
Photo: Unsplash — Vehicle taxes represent one of the largest recurring costs of car ownership globally
Advertisement
1. Global Vehicle Tax Revenue: The $1 Trillion Picture
Vehicle-related taxation has become one of the most significant revenue streams for governments worldwide. In 2026, the global total surpassed $1.058 trillion — a 55.6% increase from $680 billion in 2015, according to OECD Fiscal Monitor data and World Bank transport finance estimates.[1]
OECD nations alone account for approximately $645 billion of this total, with the European Union contributing the largest share per capita. The growth has been driven by three forces: rising vehicle ownership in emerging markets, escalating fuel excise duties in Europe, and the proliferation of new tax instruments targeting carbon emissions.
The COVID-19 pandemic caused a sharp 8.8% dip in 2020 as vehicle sales collapsed and fuel consumption fell. But the recovery was swift — by 2022, global vehicle tax revenues had not only recovered but exceeded pre-pandemic levels, driven by record car sales and fuel price volatility that amplified ad-valorem tax receipts.
Global Vehicle Tax Revenue 2015–2026 (USD Billions)
Source: OECD Fiscal Monitor, World Bank Transport Finance Database, IMF Revenue Statistics [1][2]
The trajectory is clear: vehicle taxes are not declining despite the EV transition. In fact, many governments are actively designing new tax frameworks to replace fuel duty revenue as combustion engines phase out. The UK's Vehicle Excise Duty (VED) reform in 2025 brought EVs into the tax net for the first time, while Germany is piloting a distance-based road charge for heavy vehicles.
For car buyers, this means the total tax burden on vehicle ownership is likely to increase over the next decade, not decrease — even as the mix of taxes shifts from fuel-based to usage-based and emissions-based instruments. See our Global Car Costs by Country guide for how these taxes feed into total ownership costs.
2. The 5 Types of Vehicle Taxes Explained
Vehicle taxation is not a single instrument — it is a layered system of at least five distinct tax types, each targeting a different stage of the vehicle lifecycle. Understanding the structure is essential for comparing countries fairly, since a nation with zero registration tax may impose punishing fuel duties, and vice versa.
Global Vehicle Tax Revenue by Type (2026)
Source: OECD Tax Policy Studies, IEA Energy Prices and Taxes [1][3]
1. Fuel Excise Tax (38.4%)
Levied per litre of petrol or diesel at the pump. The largest single vehicle tax globally. Ranges from $0.18/L in the USA to $1.82/L in Norway. Directly linked to fuel consumption and therefore CO₂ emissions.
2. Registration / Purchase Tax (22.1%)
A one-time tax paid when buying or first registering a vehicle. Can be a flat fee, a percentage of vehicle value, or emissions-linked. Denmark charges up to 150% of vehicle value; Germany charges nothing.
3. Annual Road Tax / VED (16.8%)
Recurring annual charge for the right to use public roads. The UK's Vehicle Excise Duty ranges from £0 (zero-emission) to £2,745/year for high-emission vehicles. Germany bases it on engine displacement and CO₂.
4. VAT on Vehicle Sales (14.2%)
Standard VAT applied to the purchase price. EU standard rate averages 21%. Some countries exempt EVs from VAT entirely (Norway) or apply reduced rates to incentivise clean vehicles.
5. Import Tariffs (5.6%)
Customs duties on imported vehicles. EU: 10%, USA: 2.5% (25% on trucks, 25% on all imports from 2026), China: 15%, India: 60–100%, Brazil: 35%. A major driver of price differentials between markets.
6. Other: Tolls & Congestion (2.9%)
Urban congestion charges (London £15/day, Stockholm SEK 11–45, Singapore SGD 0.50–6), motorway tolls (France, Italy, Spain), and bridge/tunnel fees. Growing rapidly as cities target urban air quality.
3. Registration & Purchase Taxes by Country
Registration taxes represent the most dramatic point of divergence between national vehicle tax systems. The difference between buying the same car in Germany (€0 registration tax) versus Denmark (up to 150% of vehicle value) can amount to tens of thousands of dollars — a disparity that fundamentally shapes consumer behaviour and market structure.[4]
Singapore's Certificate of Entitlement (COE) system is the world's most extreme example. In 2026, COE premiums for Category B vehicles (above 1,600cc) reached SGD 106,000 (~$78,000 USD) — more than the cost of the car itself. The system is designed to control vehicle population density on the island-state's limited road network.
Effective Registration Tax on a Mid-Range Car (USD, 2026)
Source: KPMG Vehicle Tax Guide 2026, Deloitte Global Automotive Tax Survey [4][5]
The Netherlands' BPM (Belasting van Personenauto's en Motorrijwielen) is calculated on CO₂ emissions, meaning a Toyota Corolla Hybrid attracts far less tax than a BMW 5 Series. This emissions-linked structure has been highly effective: the Netherlands has one of Europe's lowest average fleet CO₂ outputs at 98g/km in 2025.
Denmark's registration tax, while nominally 85% on the first DKK 185,800 of value and 150% above that, was reformed in 2021 to include a green component. EVs receive a substantial reduction, though they still face higher registration costs than in most other countries.
| Country | Reg. Tax (USD) | Annual Tax (USD) | Fuel Tax ($/L) | Total Tax % of Cost |
|---|---|---|---|---|
| Norway | $0 | $580 | $1.82 | 4.1% |
| Netherlands | $8,200 | $420 | $1.54 | 5.8% |
| Denmark | $12,400 | $380 | $1.48 | 6.2% |
| Germany | $0 | $310 | $1.12 | 3.4% |
| UK | $0 | $290 | $1.08 | 3.1% |
| France | $1,200 | $260 | $1.02 | 3.6% |
| Australia | $2,800 | $480 | $0.62 | 2.9% |
| USA | $350 | $180 | $0.18 | 1.2% |
| Canada | $420 | $210 | $0.34 | 1.8% |
| Japan | $3,100 | $340 | $0.72 | 3.2% |
| China | $2,800 | $120 | $0.28 | 1.9% |
| India | $1,800 | $80 | $0.42 | 2.1% |
* Total Tax % of Cost = estimated vehicle taxes as a share of average annual vehicle-related expenditure. Sources: KPMG, Deloitte, OECD [4][5][6]
Advertisement

Photo: Unsplash — Registration taxes can add 0–150% to a vehicle's purchase price depending on the country
4. Fuel Excise Taxes: The Biggest Revenue Driver
Fuel excise taxes remain the single largest component of vehicle taxation globally, accounting for 38.4% of all vehicle-related government revenue. They are also the most politically contentious — the 2018 French "Gilets Jaunes" (Yellow Vests) protests were triggered directly by a planned fuel tax increase, forcing President Macron to reverse course.[7]
The disparity between countries is stark. Norway charges $1.82 per litre in fuel excise — ten times the US federal rate of $0.184/gallon ($0.049/litre). European countries use high fuel taxes as a deliberate tool to reduce consumption, fund road infrastructure, and price in the external costs of air pollution and carbon emissions.
The US federal fuel tax has not been raised since 1993, meaning it has lost more than 50% of its real value to inflation. The American Society of Civil Engineers estimates this has contributed to a $1.2 trillion infrastructure funding gap. Several US states have introduced their own fuel tax increases, but the federal rate remains politically frozen.
Fuel Excise Tax vs. Total Pump Price (USD/Litre, 2026)
Source: IEA Energy Prices and Taxes Q2 2026, GlobalPetrolPrices.com [3][8]
In Norway, fuel taxes represent 85% of the pump price — the highest ratio globally. This is intentional: Norway uses high fuel taxes to fund its sovereign wealth fund while simultaneously incentivising EV adoption through registration tax exemptions. The strategy has worked spectacularly — Norway's EV market share reached 88.9% of new car sales in 2026.
The UK's fuel duty freeze (maintained since 2011) has cost the Treasury an estimated £40 billion in foregone revenue. With EV adoption accelerating, the Office for Budget Responsibility projects fuel duty revenues will fall by 50% by 2035, creating a fiscal cliff that road pricing must fill. For more on how fuel costs affect total ownership, see our EV Charging Costs vs Gas 2026 analysis.
5. Annual Road Taxes & Vehicle Excise Duty
Annual road taxes — charged for the ongoing right to use public roads — vary enormously in their structure and rationale. The UK's Vehicle Excise Duty (VED) is the most sophisticated emissions-linked system globally, with 13 bands ranging from £0 for zero-emission vehicles to £2,745/year for cars emitting over 255g/km of CO₂.[9]
Germany's Kraftfahrzeugsteuer (KFZ-Steuer) is calculated on a combination of engine displacement and CO₂ emissions. A 2.0-litre petrol car emitting 150g/km pays approximately €310/year, while a comparable EV pays €0 (exempt until 2030 under current law).
Australia's approach is notably different: annual registration fees are set by state governments and are largely flat-rate, with minimal emissions linkage. Victoria charges $900.70/year for a standard passenger vehicle regardless of its CO₂ output — a structure critics argue provides no environmental signal.
📊 Key Annual Road Tax Rates (2026)
France's "malus écologique" is particularly aggressive: cars emitting over 225g/km CO₂ face a one-time surcharge of up to €60,000 — effectively banning high-emission vehicles from the market by making them economically unviable. This has driven French fleet average CO₂ down to 103g/km in 2025, among the lowest in the G7. Compare this to our Global Vehicle Pollution Report 2026 for the environmental outcomes of these policies.
6. EV Tax Incentives vs. ICE Penalties: The Global Policy Divide
The most significant shift in vehicle taxation over the past decade has been the emergence of a two-tier system: generous incentives for electric vehicles paired with escalating penalties for high-emission internal combustion engine (ICE) vehicles. This "carrot and stick" approach is reshaping global car markets at unprecedented speed.[10]
Norway's approach is the most extreme globally. EVs are exempt from the country's 25% VAT (saving ~$10,000 on a $40,000 car), exempt from registration tax (saving up to $12,000), and pay reduced annual road tax. The result: 88.9% of new cars sold in Norway in 2026 are electric — the highest rate in the world by a wide margin.
EV Tax Incentive Value vs. EV Market Share by Country (2026)
Source: IEA Global EV Outlook 2026, ACEA, BloombergNEF [10][11]
The correlation between incentive value and EV adoption is strong but not perfect. China's $3,200 incentive has driven a 38.6% EV market share — outperforming the USA's $7,500 credit which has achieved only 9.4% share. The difference lies in complementary policies: China's EV licence plate priority (avoiding 6-month waits for ICE plates in major cities) and mandatory EV quotas for manufacturers create structural demand that tax incentives alone cannot replicate.
The USA's Inflation Reduction Act (IRA) $7,500 EV tax credit has been effective but complex. Income caps ($150,000 for single filers), vehicle price caps ($55,000 for cars, $80,000 for SUVs/trucks), and domestic content requirements have limited eligibility. In 2026, only 38% of EV models sold in the US qualify for the full credit.
For a deeper dive into EV economics, see our True Total Cost of EV Ownership and Global EV Statistics 2026 reports.
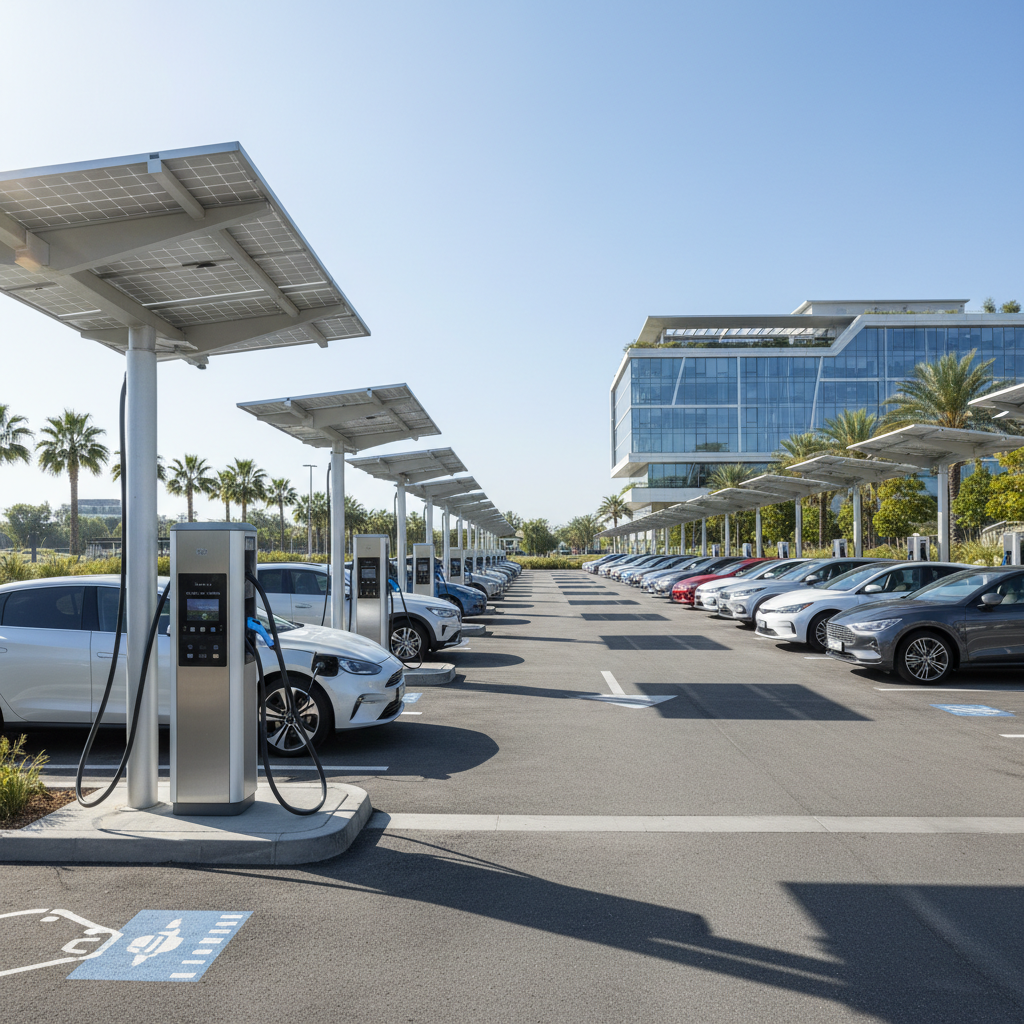
Photo: Unsplash — EV tax incentives range from $1,800 (India) to $12,000+ (Norway) and are the primary driver of adoption rates
7. Import Tariffs & Their Impact on Car Prices
Import tariffs on vehicles are one of the most politically charged aspects of global automotive trade. They function simultaneously as revenue instruments, industrial policy tools, and trade weapons — and their impact on consumer prices can be immediate and severe.[12]
The 2026 US tariff escalation — raising duties on all imported passenger vehicles to 25% — is the most significant automotive trade policy shift since the 1980s "Voluntary Export Restraints" on Japanese cars. Cox Automotive estimates the tariffs added an average of $4,200 to the price of affected vehicles, with European luxury brands (BMW, Mercedes, Audi, Volvo) seeing the largest absolute increases.
| Country/Region | Import Tariff (Cars) | Import Tariff (Trucks/SUVs) | Notable Policy |
|---|---|---|---|
| USA | 25% | 25% | 2026 universal tariff; was 2.5% cars / 25% trucks |
| European Union | 10% | 22% | Additional 35.3% on Chinese EVs from 2024 |
| China | 15% | 25% | Reduced from 25% in 2018 trade deal |
| India | 60–100% | 60% | Highest among G20; EV imports at 15% (pilot) |
| Brazil | 35% | 35% | Mercosur preferential rates for regional trade |
| Australia | 0% | 0% | Eliminated all vehicle tariffs in 2010 |
| Japan | 0% | 0% | Zero tariffs; non-tariff barriers historically significant |
| South Korea | 8% | 10% | Reduced under KORUS FTA for US vehicles |
The EU's additional 35.3% countervailing duty on Chinese EVs (imposed in October 2024 and maintained in 2026) has effectively blocked Chinese EV brands from the European market. BYD, SAIC, and Geely faced combined tariffs of up to 45.3%, making their vehicles uncompetitive against European-made rivals. China has challenged these duties at the WTO.
India's 60–100% import tariffs have long been a barrier to market entry for foreign automakers. Tesla's repeated attempts to enter India have stalled over tariff negotiations. The government's 2023 EV import pilot — allowing 35,000 EVs/year at 15% tariff for manufacturers committing to local production — has attracted limited uptake. For context on how tariffs affect buying decisions, see our Car Tariffs 2026 Buying Guide.
8. The Future: Road Pricing & VMT Taxes
The single most important trend in vehicle taxation over the next decade is the transition from fuel-based taxes to usage-based road pricing. As EVs displace combustion engines, fuel duty revenues will collapse — the UK Treasury projects a £35 billion annual shortfall by 2040 if no replacement is found.[13]
Vehicle Miles Traveled (VMT) taxes charge drivers per mile driven, regardless of fuel type. Oregon's OReGO program — the world's first operational VMT system — charges 1.9 cents per mile and has been running since 2015. Utah and Virginia have followed with their own pilots. The US Congressional Budget Office has recommended a national VMT tax as the long-term replacement for the federal fuel tax.
UK Road Pricing
Government consultation launched Q1 2026. Proposed rate: 6–15p/mile depending on road type and time of day. Expected implementation: 2030–2032.
EU Distance Charging
Eurovignette reform requires all EU member states to implement distance-based charging for heavy vehicles by 2027. Passenger car extension under discussion.
Singapore ERP 2.0
World's most advanced road pricing system. GPS-based, charges vary by location, time, and congestion level. Average driver pays SGD $150–300/month.
The privacy implications of GPS-based road pricing are significant. Surveys consistently show that 60–70% of drivers oppose mileage-based taxes on privacy grounds, even when they would pay less than under current fuel taxes. Governments are exploring privacy-preserving alternatives including odometer-based reporting (no GPS) and blockchain-based anonymous mileage verification.
For drivers, the key implication is clear: the era of "free" EV driving — where EVs paid no fuel tax and minimal road tax — is ending. By 2030, most OECD countries will have some form of usage-based charge that applies equally to EVs and ICE vehicles. The total tax burden on driving is unlikely to fall; it will simply be restructured. Use our EV vs Fuel Cost Calculator to model how these changes affect your total cost of ownership.
9. Key Takeaways & Policy Implications
Vehicle taxes are a $1 trillion global industry
Governments collected $1.058 trillion in vehicle-related taxes in 2026. This is not a niche policy area — it is one of the largest single revenue streams for most OECD governments, comparable in scale to corporate income tax in many countries.
The USA is a global outlier in low vehicle taxation
At 1.2% of vehicle cost in total taxes, the US imposes the lowest vehicle tax burden among major economies. This reflects both political constraints (the fuel tax freeze since 1993) and structural factors (car dependency, dispersed geography). It also means US drivers face the largest potential tax increases as road pricing is introduced.
Emissions-linked taxes work — but create equity concerns
Countries with strong CO₂-linked registration and annual taxes (Netherlands, France, UK) have achieved significantly lower fleet emissions than those without. However, these taxes are regressive: lower-income households spend a higher share of income on vehicle taxes and are less able to switch to EVs to reduce their burden.
EV incentives are being withdrawn as adoption scales
Norway has begun phasing out EV VAT exemptions as market share exceeds 80%. Germany ended its EV purchase subsidy in December 2023. The UK brought EVs into the VED system in 2025. The "free ride" for EV owners is ending globally — plan accordingly.
Road pricing is the future — prepare for it
VMT taxes, GPS-based road pricing, and distance charges will replace fuel duties over the next decade. Drivers who currently benefit from low EV running costs should factor in future road pricing when calculating long-term ownership costs.
Citations & Sources
- [1]OECD Fiscal Monitor (2026). "Revenue Statistics: Vehicle and Transport Taxes." OECD Publishing, Paris.
- [2]World Bank Transport Finance Database (2026). "Global Transport Tax Revenue Estimates 2015–2026."
- [3]IEA Energy Prices and Taxes Q2 2026. International Energy Agency, Paris.
- [4]KPMG Global Vehicle Tax Guide 2026. KPMG International.
- [5]Deloitte Global Automotive Tax Survey 2026. Deloitte Insights.
- [6]OECD Tax Policy Studies No. 28: "Taxing Vehicles, Fuels and Road Use." OECD Publishing.
- [7]Chrisafis, A. (2018). "France suspends fuel tax rise after gilets jaunes protests." The Guardian.
- [8]GlobalPetrolPrices.com (2026). "Gasoline and Diesel Prices by Country, Q2 2026."
- [9]UK DVLA (2026). "Vehicle Excise Duty Rates 2026–27." HM Revenue & Customs.
- [10]IEA Global EV Outlook 2026. International Energy Agency, Paris.
- [11]BloombergNEF Electric Vehicle Outlook 2026. BloombergNEF.
- [12]Cox Automotive (2026). "Impact of 2026 Vehicle Import Tariffs on US Auto Market." Cox Automotive Research.
- [13]UK Office for Budget Responsibility (2026). "Fiscal Risks and Sustainability Report: Transport Tax Revenues."
Frequently Asked Questions
Advertisement
Advertisement