Advertisement
1. The Scale of the Problem: Global Overview
The global vehicle fleet reached 1.56 billion registered vehicles in 2026, up from 1.0 billion in 2010. This explosive growth — driven primarily by rising incomes in Asia, Africa, and Latin America — has made road transport the single largest source of urban air pollution and the third-largest source of global greenhouse gas emissions after electricity generation and industry.
According to the International Energy Agency (IEA), road transport alone accounts for 8.43 billion tonnes of CO₂ equivalent per year as of 2025–2026. When aviation, shipping, and rail are included, the entire transport sector contributes approximately 23% of global CO₂ emissions — making it the fastest-growing emissions sector since 1990.
The consequences extend far beyond climate change. The World Health Organization (WHO) classifies outdoor air pollution — of which vehicle exhaust is the dominant urban source — as a Group 1 carcinogen. An estimated 4.2 million people die prematurely each year from outdoor air pollution, with road transport responsible for a disproportionate share in urban areas where 57% of the world's population now lives.
Key Finding
Transport emissions grew 77% between 1990 and 2022 — faster than any other end-use sector. Despite the EV revolution, absolute emissions have not yet declined because fleet growth in developing nations outpaces electrification in developed ones.
This report synthesises data from the IEA, WHO, IPCC, OECD, EPA, European Environment Agency (EEA), and IQAir to provide the most comprehensive picture of vehicle pollution available in 2026. For context on how vehicle costs relate to environmental impact, see our EV vs Gas Cost Comparison and Global EV Statistics 2026.
2. CO₂ Emission Trends 2000–2026
Transport CO₂ emissions followed a relentless upward trajectory from 2000 to 2019, interrupted only by the COVID-19 pandemic in 2020 (which caused a temporary 13% drop). By 2022, emissions had rebounded to near-record levels, and 2025–2026 data suggests a plateau — but not yet a decline.
The IEA's 2026 World Energy Outlook notes that while EV adoption is accelerating, the global vehicle fleet is still growing faster than electrification can offset. The net result: transport CO₂ is essentially flat at 8.43 Gt/year, compared to the 50% reduction required by 2035 under the Paris Agreement's 1.5°C pathway.
Global Transport CO₂ Emissions vs Total Global CO₂ (Gt/year)
Sources: IEA World Energy Outlook 2026, Global Carbon Project 2025. Transport includes road, aviation, shipping, and rail.
The 2020 dip is instructive: even a near-total halt to global aviation and a 15% reduction in road travel only reduced transport emissions by 13%. This illustrates the structural challenge — the existing fleet of 1.56 billion vehicles continues to emit even during economic downturns, and recovery is rapid.
Notably, the composition of transport emissions has shifted. In 2000, passenger cars dominated. By 2026, heavy-duty trucks and freight account for 21% of transport CO₂ — and this segment is the hardest to electrify due to range, payload, and charging infrastructure requirements.
3. Vehicle Emissions by Country
The distribution of vehicle emissions is deeply unequal. The United States and China together account for over 40% of global road transport CO₂ despite representing only 23% of the world's population. However, on a per-capita basis, the picture is even more striking: Americans emit 5.01 tonnes of CO₂ per person from road transport annually — nearly 15 times the Indian average.
Road Transport CO₂ by Country — Total vs Per Capita (2026)
Sources: IEA, EPA, EEA, UNFCCC National Inventory Reports 2025–2026.
| Country/Region | Total CO₂ (Mt) | Per Capita (t) | Global Share |
|---|---|---|---|
| China | 1,820 | 1.28 | 21.6% |
| USA | 1,680 | 5.01 | 19.9% |
| EU-27 | 820 | 1.84 | 9.7% |
| India | 480 | 0.34 | 5.7% |
| Brazil | 210 | 0.98 | 2.5% |
| Russia | 290 | 2.01 | 3.4% |
| Japan | 210 | 1.68 | 2.5% |
| Canada | 185 | 4.78 | 2.2% |
| Australia | 100 | 3.87 | 1.2% |
| UK | 110 | 1.62 | 1.3% |
China's total emissions are the world's highest, but its per-capita figure (1.28t) reflects a large population and a vehicle fleet that, while enormous in absolute terms, is still growing from a lower base. China's aggressive EV push — with 38% of new car sales being electric in 2026 — is beginning to bend the emissions curve.
The EU-27 has made the most consistent progress, reducing transport CO₂ by 12% since 2019 through a combination of fleet electrification, fuel efficiency standards, and urban mobility policies. The UK, despite Brexit, has maintained similar trajectories under its own Zero Emission Vehicle mandate. For global car ownership context, see our Global Car Ownership Report 2026.
4. What Vehicles Actually Emit: Beyond CO₂
The climate conversation focuses on CO₂, but vehicles emit a complex cocktail of pollutants with immediate, local health consequences that are often more severe than long-term climate effects for nearby populations.
Vehicle Emission Composition by Weight
Source: EEA EMEP/EEA Air Pollutant Emission Inventory Guidebook 2025.
CO₂ (Carbon Dioxide)
Primary greenhouse gas. Traps heat, drives climate change. Persists in atmosphere 300–1,000 years.
NOₓ (Nitrogen Oxides)
Forms ground-level ozone and smog. Causes respiratory disease. Diesel engines are primary source.
PM2.5 (Fine Particles)
Penetrates deep into lungs and bloodstream. Linked to heart attacks, stroke, and lung cancer.
VOCs (Volatile Organics)
Precursors to ozone formation. Includes benzene, a known carcinogen.
CO (Carbon Monoxide)
Reduces blood oxygen capacity. Dangerous at high concentrations in tunnels and garages.
A critical distinction: diesel vehicles emit significantly more NOₓ and PM2.5 than petrol vehicles, while petrol vehicles emit more CO and VOCs. This is why European cities that aggressively promoted diesel in the 2000s (as a CO₂ reduction strategy) now face acute NOₓ crises — the infamous "Dieselgate" scandal revealed that real-world NOₓ emissions from diesel cars were 5–40 times higher than laboratory test values.
Electric vehicles eliminate tailpipe emissions entirely, but generate non-exhaust particulate matter from tyre and brake wear — a growing concern as EVs are heavier than equivalent ICE vehicles. Studies suggest EVs generate 20–30% more tyre wear particles than comparable petrol cars, though this is offset by regenerative braking reducing brake dust by up to 90%.
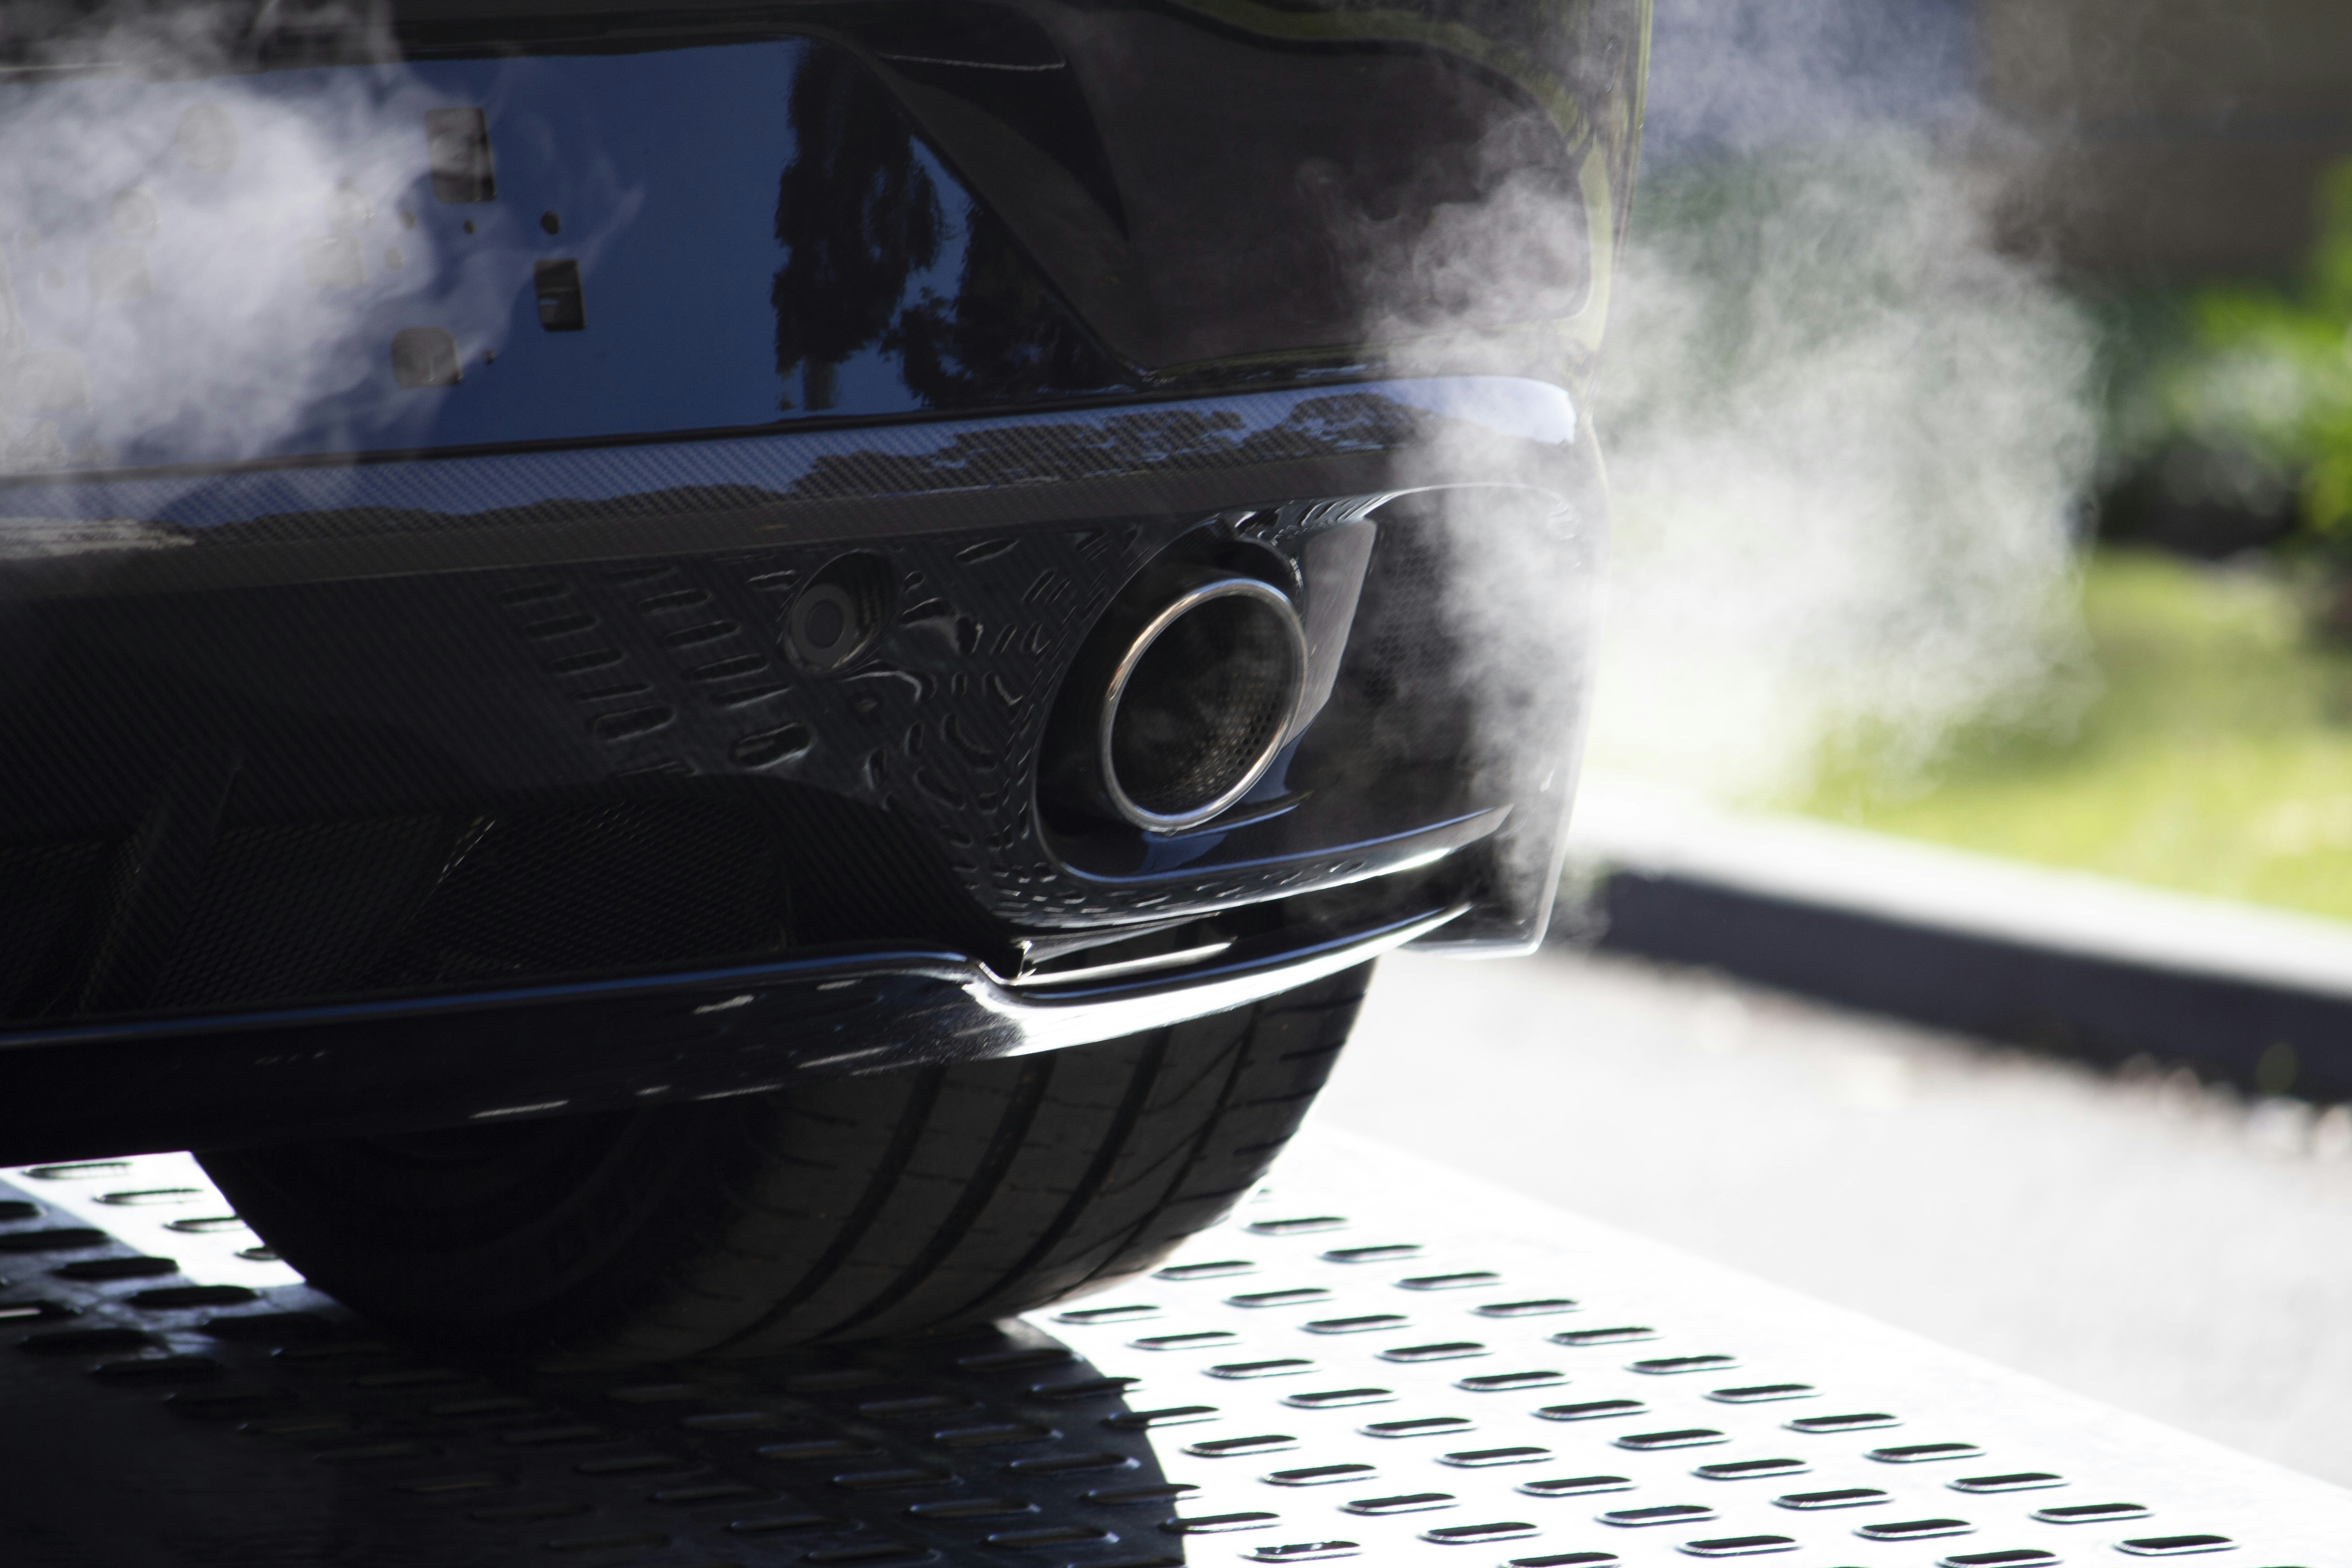
Tailpipe emissions from internal combustion engines contain CO₂, NOₓ, PM2.5, and other harmful pollutants. Photo: Unsplash
5. Health & Economic Costs of Vehicle Pollution
Advertisement
The health burden of vehicle pollution is staggering and deeply inequitable. Low- and middle-income countries bear 91% of premature deaths from outdoor air pollution despite contributing far less to the problem on a per-capita basis. Children, the elderly, and those with pre-existing respiratory or cardiovascular conditions are most vulnerable.
Annual Premature Deaths from Vehicle Air Pollution by Region (thousands)
Sources: WHO Global Ambient Air Quality Database 2024, Health Effects Institute State of Global Air 2025.
The OECD's 2025 Cost of Air Pollution report estimates the global economic cost of vehicle-related air pollution at $2.1 trillion annually — equivalent to 2.1% of global GDP. This includes direct healthcare costs ($420 billion), lost labour productivity ($680 billion), and the statistical value of premature mortality ($1.0 trillion).
In the United States, the EPA estimates transportation-related air pollution costs approximately $380 billion per year in health damages — roughly $1,140 per American annually. This "hidden cost" of driving is rarely factored into car ownership calculations. Our True Cost of Car Ownership guide explores the full financial picture.
Children are particularly vulnerable: studies published in The Lancet (2024) found that children living within 50 metres of a major road have a 30% higher risk of asthma and measurably lower lung function development. In cities like Delhi, Jakarta, and Karachi, children's lungs are developing in air that exceeds WHO guidelines by 10–20 times.
6. Urban Air Quality: City Rankings 2026
IQAir's 2026 World Air Quality Report, which monitors PM2.5 concentrations across 7,812 cities in 134 countries, reveals that 97% of the world's urban population breathes air that exceeds WHO guidelines (5 μg/m³ annual mean PM2.5). Road transport is the primary source in most cities.
Annual Mean PM2.5 Concentration — Selected Cities (μg/m³, WHO guideline: 5 μg/m³)
Source: IQAir World Air Quality Report 2026. Red = Hazardous (>50), Orange = Unhealthy (20–50), Yellow = Moderate (10–20), Green = Near WHO guideline (<10).
Delhi remains the world's most polluted major city for the sixth consecutive year, with an annual mean PM2.5 of 98.6 μg/m³ — nearly 20 times the WHO guideline. Road transport accounts for approximately 28% of Delhi's PM2.5, with the remainder from industry, construction dust, crop burning, and domestic cooking.
In contrast, Scandinavian cities like Stockholm (5.8 μg/m³) and Helsinki (5.2 μg/m³) have achieved near-WHO-compliant air quality through a combination of aggressive EV adoption, congestion pricing, and investment in public transit. Stockholm's congestion charge, introduced in 2006, reduced traffic volumes by 22% and PM2.5 by 14% in the inner city.
London's Ultra Low Emission Zone (ULEZ), expanded to cover all of Greater London in 2023, has reduced roadside NO₂ by 44% and PM2.5 by 20% in the expanded zone. New York City's congestion pricing scheme, implemented in 2025, is projected to reduce vehicle traffic in Manhattan by 17% and generate $1 billion annually for public transit investment.

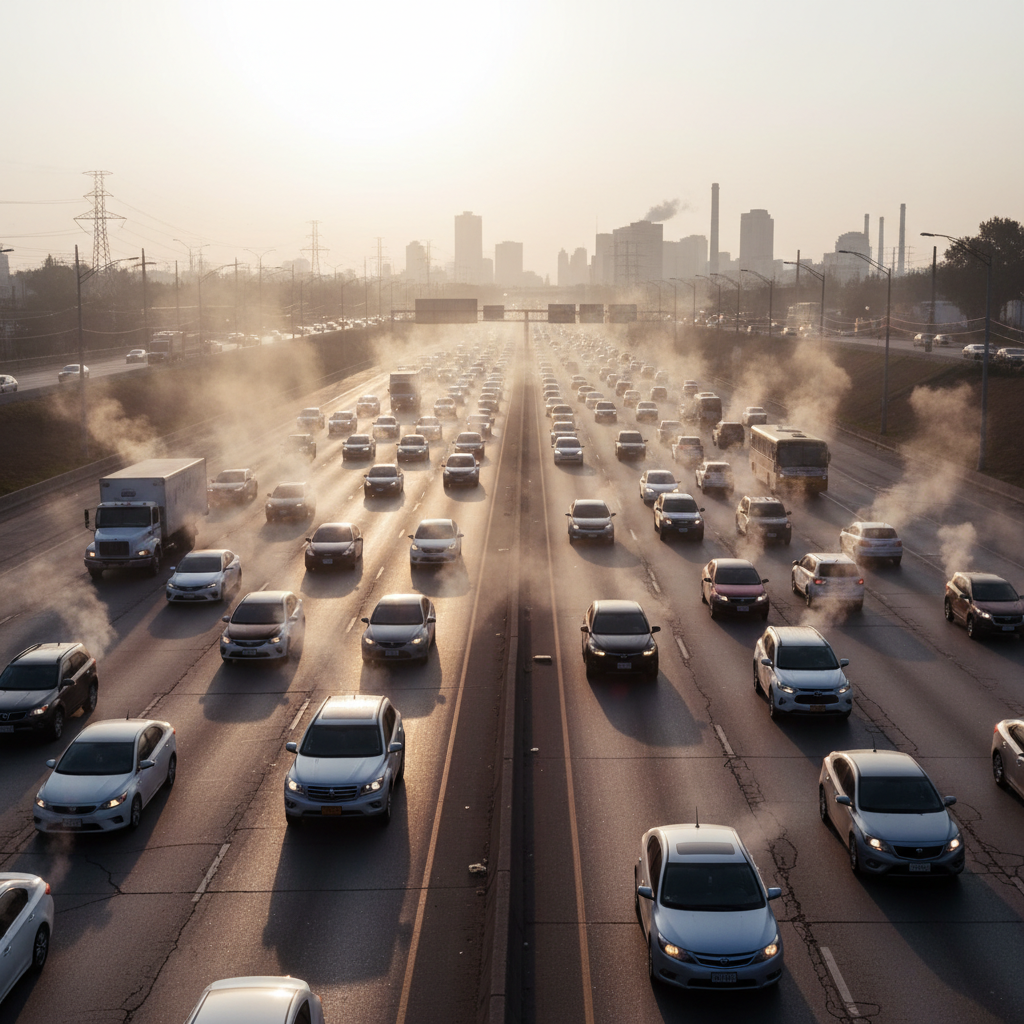
Smog over urban areas is primarily driven by vehicle NOₓ and VOC emissions reacting with sunlight to form ground-level ozone. Photo: Unsplash
7. The EV Transition & Emission Reduction Potential
The electric vehicle revolution is the most significant structural shift in the automotive industry since the mass production of the internal combustion engine. Global EV sales reached 38% of all new car sales in 2026, up from just 2.5% in 2019. Yet the impact on total transport emissions has been muted — because the existing fleet of 1.56 billion vehicles turns over slowly.
EV Market Share vs Transport CO₂ Emissions (2019–2026)
Sources: IEA Global EV Outlook 2026, IEA World Energy Outlook 2026. The lag between EV adoption and emissions reduction reflects slow fleet turnover.
The chart illustrates the "fleet turnover lag" — even as EV sales soar, the 15–20 year average vehicle lifespan means the existing ICE fleet continues to emit for decades. The IEA estimates that EVs sold in 2026 will displace approximately 180 million tonnes of CO₂ over their lifetimes — significant, but a fraction of the 8.43 Gt emitted annually.
Lifecycle analysis is critical here. A battery EV charged on the average global electricity grid (which is still 60% fossil fuels) produces approximately 50–70% fewer lifecycle CO₂ emissions than an equivalent petrol car. In countries with clean grids — Norway (98% hydro), France (70% nuclear), Sweden (95% renewables) — the reduction exceeds 85%. In countries with coal-heavy grids like Poland or India, the advantage narrows to 20–40%.
For a detailed analysis of EV economics, see our EV Total Cost of Ownership guide and EV Maintenance Costs comparison. For global EV data, our Global EV Statistics 2026 report provides comprehensive market analysis.
8. Global Policy Responses
Governments worldwide have implemented a range of policies to reduce vehicle emissions, with varying degrees of ambition and effectiveness. The most impactful interventions combine demand-side measures (carbon pricing, congestion charges, EV incentives) with supply-side regulations (fleet emission standards, ICE bans).
The EU's landmark regulation mandates that all new passenger cars and light commercial vehicles sold from 2035 must have zero CO₂ emissions. This effectively bans new petrol and diesel car sales. Combined with Euro 7 emission standards (2025), the EU is the world's most aggressive major market on vehicle emissions.
📊 Projected 50% reduction in EU road transport CO₂ by 2035 vs 2021 baseline.
The EPA's 2026 Multi-Pollutant Emission Standards require that 56% of new car sales be zero-emission by 2032. The Inflation Reduction Act provides $7,500 EV tax credits for qualifying vehicles, with income and price caps. California's Advanced Clean Cars II rule requires 100% ZEV sales by 2035.
📊 IRA EV credits have accelerated US EV adoption by an estimated 3–5 percentage points.
China's New Energy Vehicle (NEV) mandate requires automakers to earn credits for EV sales, with penalties for non-compliance. China's national carbon trading scheme covers the power sector and is expanding to transport. BYD's dominance (100% EV) has made China the world's largest EV market by volume.
📊 China accounted for 58% of global EV sales in 2026, with 38% of new car sales being electric.
India's Faster Adoption and Manufacturing of Electric Vehicles (FAME III) scheme provides subsidies for EVs and charging infrastructure. Bharat Stage 6 (BS6) emission standards, equivalent to Euro 6, have significantly reduced per-vehicle NOₓ and PM emissions since 2020.
📊 India's EV market grew 89% in 2025, though from a low base (8% of new sales).
Beyond national policies, city-level interventions have proven highly effective. Low Emission Zones (LEZs) now operate in over 320 European cities. Congestion pricing schemes in London, Stockholm, Singapore, and New York have demonstrated that pricing road access reduces both traffic volumes and emissions. Oslo has achieved 90%+ EV market share through a combination of purchase incentives, free parking, toll exemptions, and bus lane access for EVs.
9. Projections to 2035: Three Scenarios
The IEA's 2026 World Energy Outlook models three scenarios for transport emissions through 2035. The divergence between scenarios is enormous — the difference between the Stated Policies and Net Zero scenarios represents approximately 3.5 billion tonnes of CO₂ per year by 2035.
Stated Policies (STEPS)
Current policies maintained. EV adoption accelerates but fleet turnover is slow. Emissions plateau then decline modestly. Consistent with 2.5°C warming.
Announced Pledges (APS)
All government pledges and targets met. Significant emissions reduction but still above Paris Agreement pathway. Requires major policy implementation.
Net Zero by 2050 (NZE)
Rapid electrification, modal shift to public transit, and clean electricity. Requires unprecedented policy action and investment. Consistent with Paris 1.5°C target.
The critical insight from these scenarios is that technology alone is insufficient. Even under the Net Zero scenario, which assumes 90% EV new car sales by 2035, transport emissions only fall to 4.6 Gt — still 45% above the level required for a 1.5°C pathway. The remaining reductions must come from modal shift (more public transit, cycling, walking), reduced vehicle kilometres travelled, and decarbonisation of freight.
The IEA estimates that achieving the Net Zero scenario requires $4.5 trillion in cumulative transport investment between 2026 and 2035 — in charging infrastructure, grid upgrades, public transit, and vehicle manufacturing capacity. This represents both the scale of the challenge and the scale of the economic opportunity. For context on how global fuel consumption fits into this picture, see our Global Fuel Consumption Report 2026.
Road Transport CO₂ by Vehicle Type (2026, Gt/year)
Source: IEA Tracking Transport 2026. Passenger cars and light trucks/SUVs together account for 63% of road transport CO₂.
📚 Citations & Data Sources
- [1]International Energy Agency (IEA). World Energy Outlook 2026. Paris: IEA, 2026.
- [2]IEA. Global EV Outlook 2026: Accelerating the Transition. Paris: IEA, 2026.
- [3]IEA. Tracking Transport 2026. Paris: IEA, 2026.
- [4]World Health Organization (WHO). Ambient Air Quality Database 2024. Geneva: WHO, 2024.
- [5]Health Effects Institute. State of Global Air 2025. Boston: HEI, 2025.
- [6]OECD. The Cost of Air Pollution: Health Impacts of Road Transport. Paris: OECD Publishing, 2025.
- [7]Intergovernmental Panel on Climate Change (IPCC). AR6 Synthesis Report: Climate Change 2023. Geneva: IPCC, 2023.
- [8]European Environment Agency (EEA). EMEP/EEA Air Pollutant Emission Inventory Guidebook 2025. Copenhagen: EEA, 2025.
- [9]IQAir. World Air Quality Report 2026. Goldach: IQAir, 2026.
- [10]Global Carbon Project. Global Carbon Budget 2025. Earth System Science Data, 2025.
- [11]US Environmental Protection Agency (EPA). Inventory of U.S. Greenhouse Gas Emissions and Sinks 2026. Washington: EPA, 2026.
- [12]The Lancet. "Traffic-related air pollution and childhood respiratory health." The Lancet, 2024.
Frequently Asked Questions
🔗 Related Reports & Guides
Advertisement
Advertisement