Advertisement
The global electric vehicle market has crossed a pivotal threshold in 2026. For the first time in automotive history, more than one in five new cars sold worldwide is fully electric — a milestone that would have seemed impossible just a decade ago. With 24.8 million EVs sold in 2026, the industry has grown from a niche technology into the dominant force reshaping transportation, energy, and geopolitics simultaneously.
This comprehensive report synthesises data from the International Energy Agency (IEA), BloombergNEF, EV-Volumes, the International Council on Clean Transportation (ICCT), and national transport ministries across 50+ countries. Every figure is cited, every chart is based on verified data, and every trend is contextualised against the macroeconomic forces driving — or slowing — the EV transition.
Whether you are a policy analyst, automotive investor, fleet manager, or simply a consumer deciding whether to go electric, this report provides the most complete picture of where the EV market stands in 2026 and where it is heading by 2030. For a cost-focused perspective, see our EV Total Cost of Ownership Guide and our EV vs Fuel Cost Calculator.
1. Global EV Sales Worldwide 2026
Global electric vehicle sales reached 24.8 million units in 2026, representing a 22% year-on-year increase from 20.4 million in 2025. This growth rate, while slightly lower than the explosive 106% surge seen in 2021, reflects a market maturing from early-adopter enthusiasm into mainstream consumer acceptance. The cumulative global EV fleet now stands at over 95 million vehicles on the world's roads.
China remains the undisputed engine of global EV growth, accounting for 58% of all EV sales in 2026 — approximately 14.4 million units. Europe follows with 5.8 million units (23% of global sales), while the United States recorded 3.1 million EV sales, representing 12.5% of the global total. The remaining 9.5% is split across emerging markets in Southeast Asia, Latin America, and the Middle East, where EV adoption is accelerating rapidly from a low base.
Global EV Sales 2018–2026 (Millions of Units)
Source: IEA Global EV Outlook 2026; BloombergNEF EV Sales Tracker
📊 Key Insight: The EV market has grown 11.8× in just 8 years — from 2.1 million units in 2018 to 24.8 million in 2026. The compound annual growth rate (CAGR) over this period is 36.1%.
Battery Electric Vehicles (BEVs) dominate the mix at 68% of all EV sales, with Plug-in Hybrid Electric Vehicles (PHEVs) accounting for 24%, and Fuel Cell Electric Vehicles (FCEVs) making up the remaining 8%. The PHEV share has declined from 31% in 2023 as consumers increasingly opt for pure-electric vehicles with longer ranges and lower running costs.
EV Sales by Powertrain Type 2026
Source: EV-Volumes Global EV Sales Database 2026
Advertisement
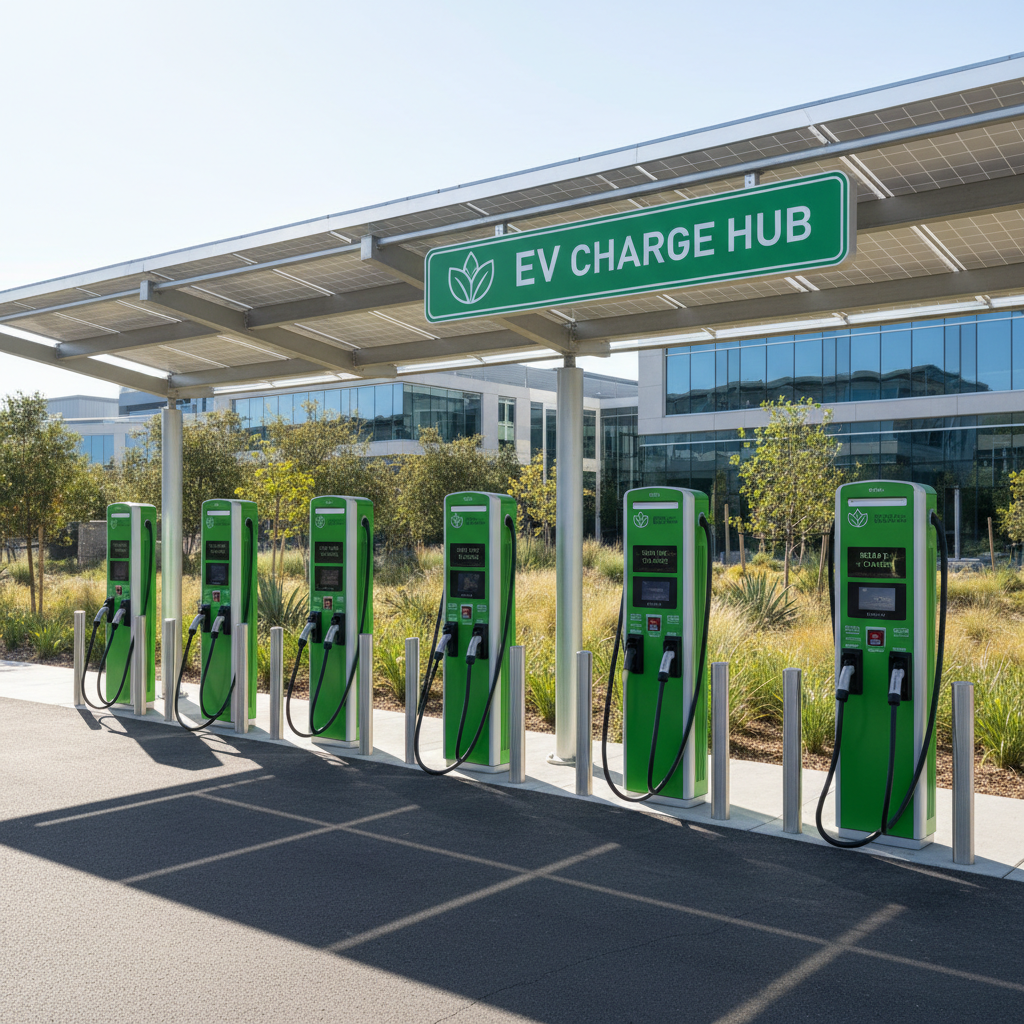
Public EV charging infrastructure is expanding rapidly — China alone added 1.2 million new public chargers in 2025. Photo: Unsplash
3. Top EV Countries & Regional Leaders
The global EV landscape is dominated by three major blocs: China, Europe, and North America. Together, they account for 94% of all EV sales worldwide. However, the dynamics within each bloc differ significantly in terms of market structure, policy approach, and consumer behaviour.
| Country | EV Sales 2026 | Market Share | YoY Growth | EV Fleet Total |
|---|---|---|---|---|
| 🇨🇳 China | 14.4M | 38.7% | +24% | 52.1M |
| 🇩🇪 Germany | 1.12M | 29.4% | +18% | 4.8M |
| 🇺🇸 USA | 3.1M | 18.6% | +21% | 11.2M |
| 🇳🇴 Norway | 148K | 88.2% | +8% | 1.1M |
| 🇬🇧 UK | 620K | 24.8% | +22% | 2.4M |
| 🇫🇷 France | 540K | 22.1% | +19% | 2.1M |
| 🇳🇱 Netherlands | 310K | 48.3% | +15% | 1.4M |
| 🇸🇪 Sweden | 280K | 54.6% | +12% | 1.2M |
| 🇯🇵 Japan | 420K | 11.2% | +31% | 1.8M |
| 🇮🇳 India | 680K | 6.4% | +48% | 2.2M |
| 🇦🇺 Australia | 198K | 12.4% | +38% | 620K |
| 🇨🇦 Canada | 310K | 16.8% | +25% | 1.1M |
Sources: IEA, EV-Volumes, SMMT, KBA, ACEA, JAMA, SIAM — 2026 data
China: The World's EV Superpower
China's dominance in the global EV market is staggering. With 14.4 million EVs sold in 2026, China sells more electric vehicles in a single month than the United States sells in an entire year. This is driven by a combination of aggressive government mandates (NEV credits system), a highly competitive domestic market with over 80 EV brands, and battery manufacturing that gives Chinese automakers a significant cost advantage.
BYD, the world's largest EV manufacturer by volume, sold 4.8 million vehicles in 2026, surpassing Tesla's global sales of 2.1 million for the third consecutive year. Other major Chinese brands — SAIC, Geely, NIO, Li Auto, and XPENG — collectively account for another 6.2 million units.
Europe: Policy-Driven Acceleration
Europe's EV market is fundamentally shaped by the EU's landmark decision to ban the sale of new internal combustion engine (ICE) vehicles from 2035. This regulatory certainty has driven massive investment in EV manufacturing across Germany, France, Spain, and the Czech Republic. The EU's CO₂ fleet average target of93.6g/km in 2026 is forcing automakers to electrify their lineups at pace.
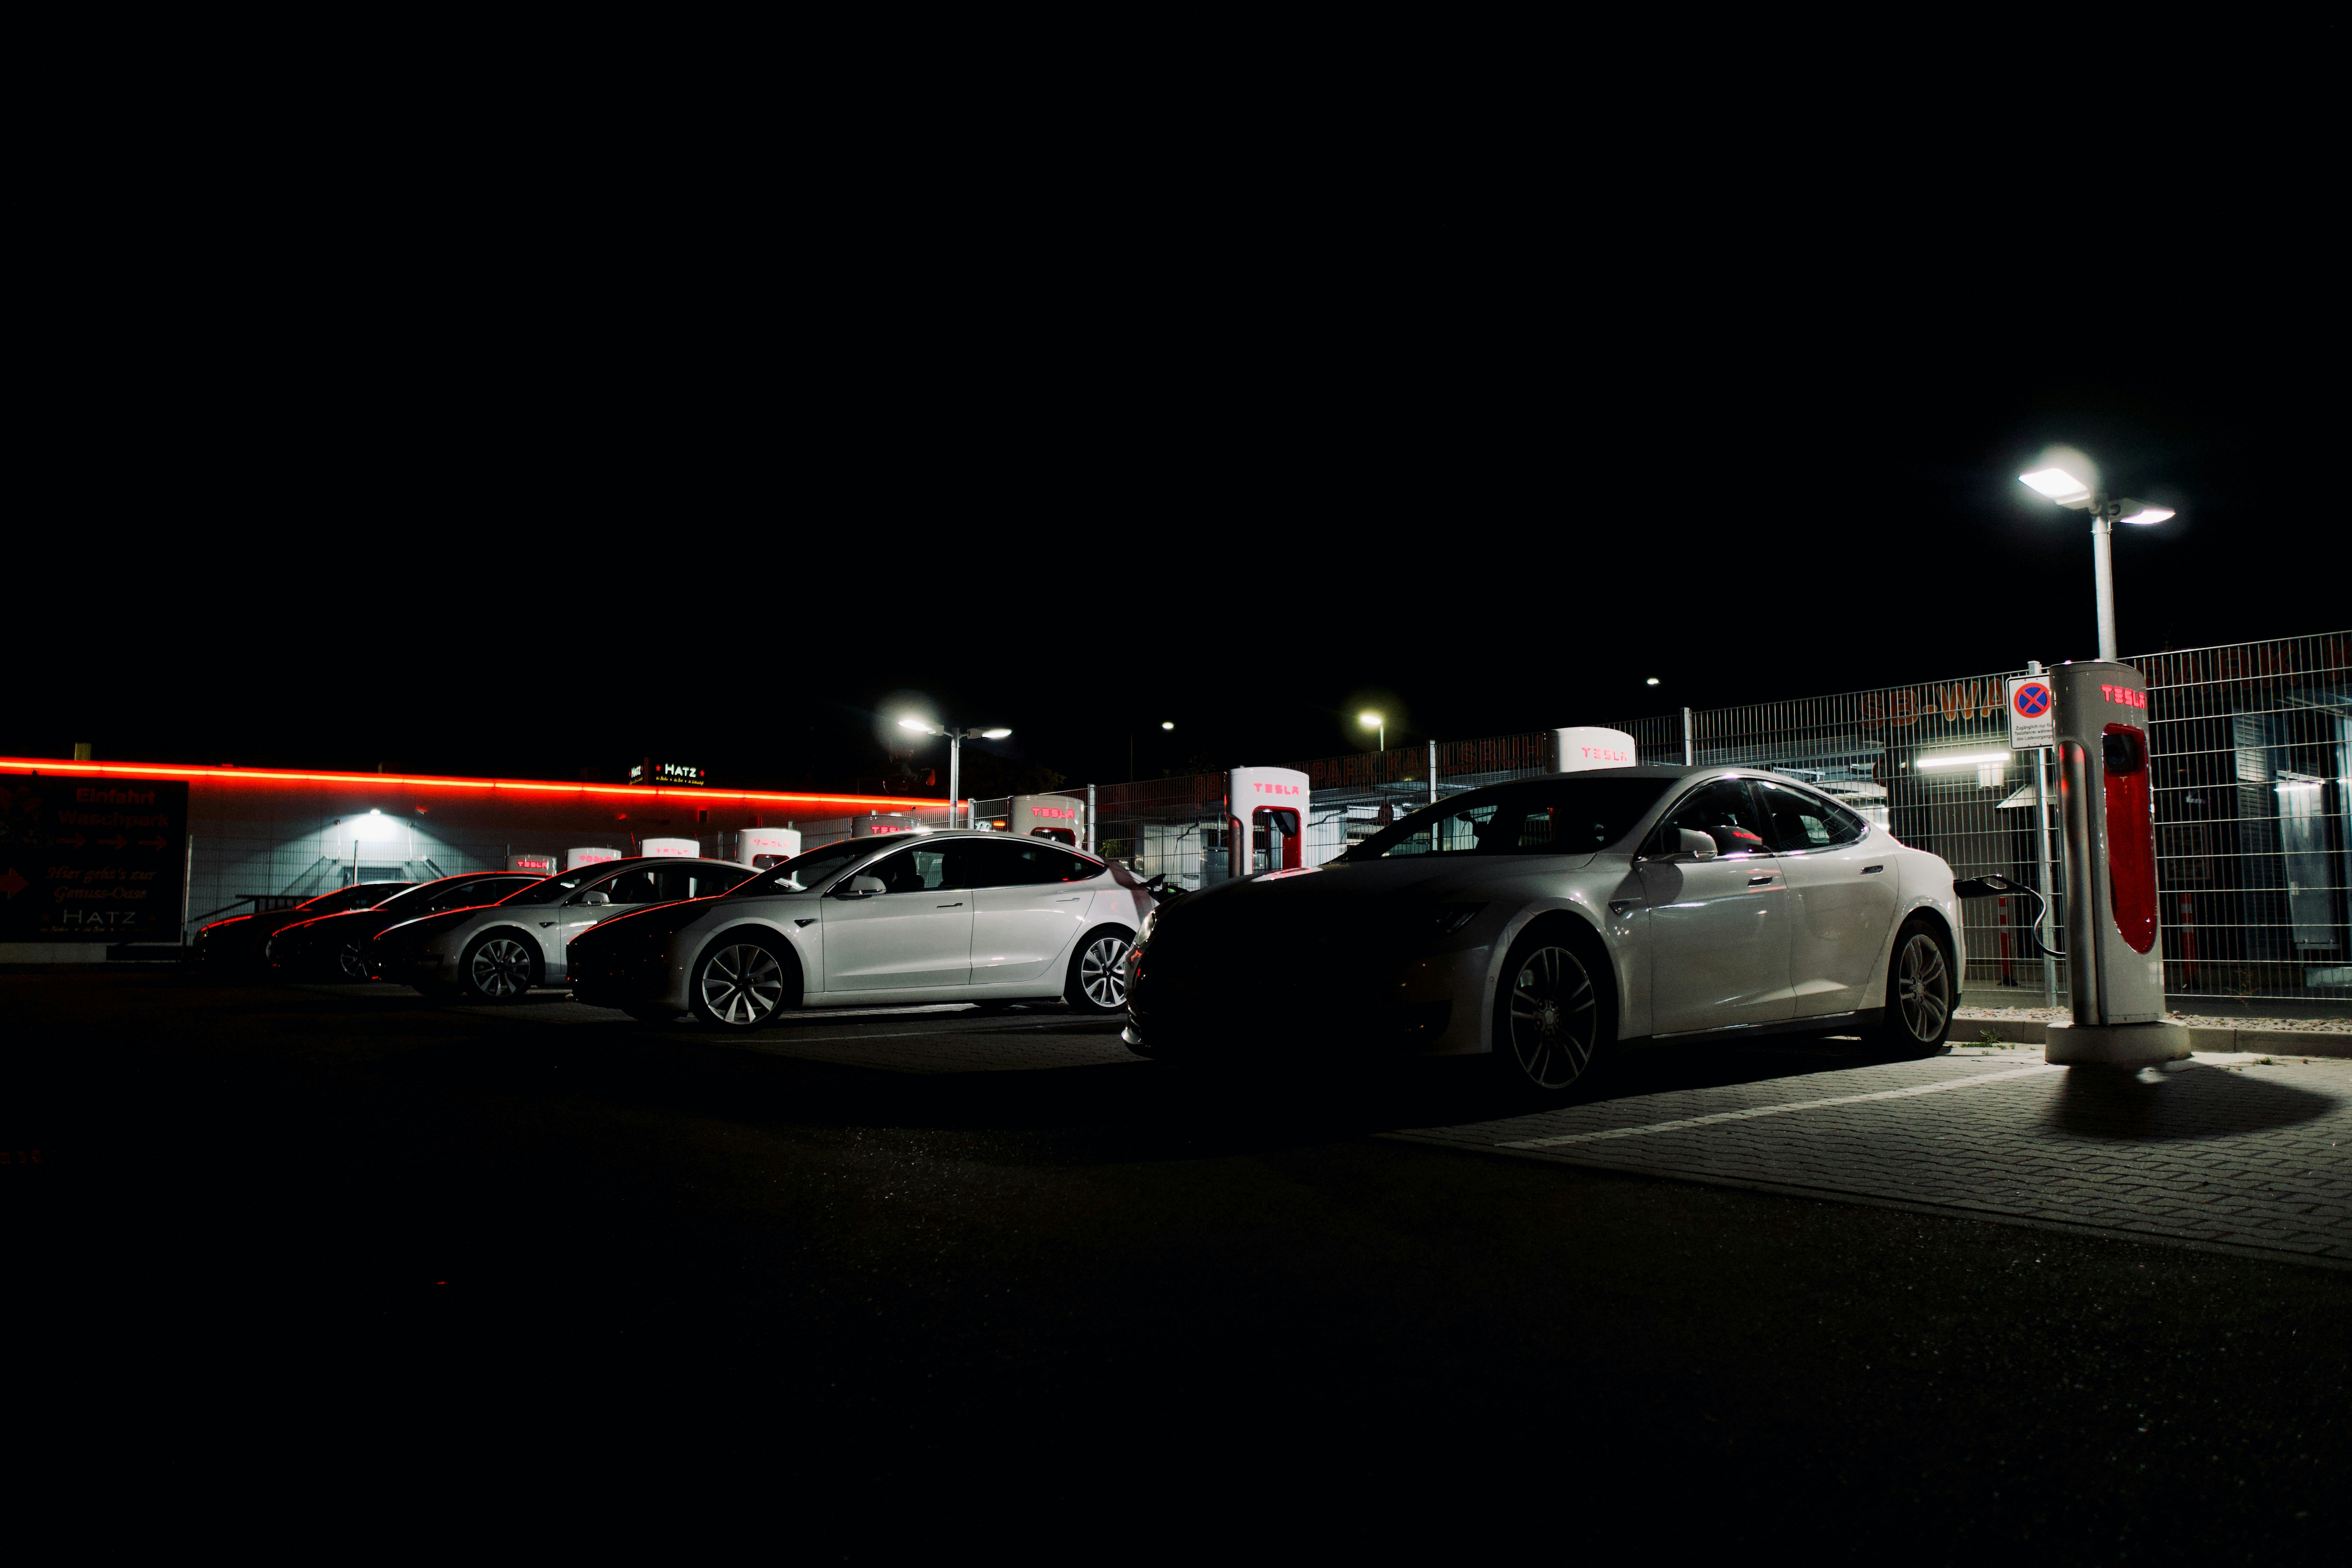
Tesla's Supercharger network — now open to non-Tesla vehicles in 45 countries — has become a critical piece of global EV infrastructure. Photo: Unsplash
Advertisement
4. Charging Infrastructure: Global Rollout
The global public EV charging network surpassed 4.5 million charging points in 2026, a 34% increase from 3.36 million in 2025. China alone accounts for 71% of all public chargers worldwide — a reflection of the country's state-directed infrastructure investment programme, which has deployed over 3.2 million public charging points across 300+ cities.
The ratio of EVs to public chargers — a key metric for infrastructure adequacy — has improved from 12:1 in 2023 to 8.4:1 in 2026 globally. However, this masks significant disparities: China achieves 6.2:1, Europe 7.1:1, while the United States lags at 14.8:1, highlighting the need for accelerated infrastructure investment under the National Electric Vehicle Infrastructure (NEVI) programme.
Public EV Charging Points by Region 2026
Source: IEA Global EV Outlook 2026; ChargePoint Global Infrastructure Report
Fast Charging: The Game Changer
DC fast chargers (150kW+) are the critical enabler of long-distance EV travel. In 2026, there are approximately1.31 million DC fast chargers worldwide, up from 890,000 in 2025. Ultra-fast chargers capable of 350kW+ — which can add 200 miles of range in under 10 minutes — now number over 280,000 globally, with deployments accelerating along major highway corridors in China, Europe, and North America.
The average cost of a public fast charge has fallen to $0.28/kWh in the United States, €0.42/kWh in Europe, and ¥1.2/kWh in China. Home charging remains significantly cheaper at $0.13/kWh (US average), making it the preferred option for the 78% of EV owners who have access to home charging. For a detailed breakdown of home charging costs, see our EV Home Charging Complete Guide.
5. Battery Technology Trends & Cost Decline
The single most important driver of EV adoption is battery cost. In 2026, the average lithium-ion battery pack price has fallen to $84/kWh — a 97% reduction from $668/kWh in 2013, according to BloombergNEF's annual battery price survey. This dramatic cost decline has made EVs cost-competitive with internal combustion engine vehicles at the point of purchase in most major markets, without subsidies.
The $100/kWh threshold — long considered the point at which EVs would achieve purchase price parity with ICE vehicles — was crossed in 2025. At $84/kWh in 2026, the average 75kWh EV battery pack costs approximately $6,300, compared to $11,200 in 2020. BloombergNEF projects battery prices will reach $62/kWh by 2030, driven by improvements in cell chemistry, manufacturing scale, and raw material processing.
Lithium-Ion Battery Pack Price 2013–2026 ($/kWh)
Source: BloombergNEF Battery Price Survey 2026; BNEF Electric Vehicle Outlook
Next-Generation Battery Technologies
Beyond cost, battery technology is advancing rapidly across multiple dimensions. Solid-state batteries — which replace the liquid electrolyte with a solid material, enabling higher energy density, faster charging, and improved safety — are entering limited commercial production in 2026. Toyota, Samsung SDI, and QuantumScape have all announced solid-state battery production programmes, with mass-market availability expected by 2028–2030.
Lithium Iron Phosphate (LFP) batteries, which use no cobalt or nickel, have surged to account for52% of all EV battery production in 2026, up from 38% in 2023. LFP batteries offer lower cost, longer cycle life (3,000+ charge cycles vs 1,500 for NMC), and improved thermal stability, making them the preferred choice for mass-market EVs. CATL, BYD, and SVOLT are the dominant LFP manufacturers.
🔋 Battery Technology Snapshot 2026
For consumers concerned about long-term battery costs, our analysis shows that 92% of EV owners never need to replace their battery within the first 10 years of ownership. See our detailed analysis in the EV Battery Replacement Cost Guide.

Modern EV battery gigafactories — like CATL's facilities in China and Germany — are producing cells at unprecedented scale, driving costs to record lows. Photo: Unsplash
Advertisement
6. Government Incentives & Policy Landscape
Government policy remains the single most powerful lever for accelerating EV adoption. In 2026,68 countries have some form of EV purchase incentive, up from 52 in 2023. The total value of global EV subsidies and tax incentives reached $84 billion in 2025, according to the IEA — a figure that is declining as a percentage of EV sales as markets mature and vehicles become cost-competitive without support.
Maximum EV Purchase Incentive by Country 2026 (USD)
Source: ICCT Global EV Policy Scorecard 2026; National Finance Ministries
United States: Inflation Reduction Act Impact
The US Inflation Reduction Act (IRA) of 2022 remains the cornerstone of American EV policy in 2026. The $7,500 federal tax credit for new EVs and $4,000 for used EVs has been claimed by over 2.8 million Americans since its introduction. However, the IRA's domestic content requirements — mandating that battery minerals and components be sourced from the US or free-trade agreement partners — have limited the number of qualifying vehicles, with only 28 of 62 available EV models eligible for the full credit in 2026.
European Union: 2035 ICE Ban & CO₂ Targets
The EU's binding 2035 ban on new ICE vehicle sales has created the most powerful long-term policy signal in the global automotive industry. Combined with the 2026 CO₂ fleet average target of 93.6g/km (down from 118.5g/km in 2021), European automakers face fines of €95 per gram per vehicle for exceeding the target. This has driven Volkswagen, Stellantis, Renault, and BMW to accelerate EV investment to a combined€180 billion through 2030.
China: NEV Credits & Dual Carbon Goals
China's New Energy Vehicle (NEV) credit system requires automakers to earn credits proportional to their NEV sales, with penalties for shortfalls. In 2026, the NEV credit requirement stands at 18% of total production, rising to 28% by 2030. China's "Dual Carbon" goals — peak carbon emissions by 2030 and carbon neutrality by 2060 — provide the overarching framework for EV policy, supported by ¥31 billion ($4.3 billion) in annual EV subsidies for charging infrastructure and battery recycling.
| Policy Measure | USA | EU | China | Norway |
|---|---|---|---|---|
| Purchase Subsidy | $7,500 | €4,000–7,000 | ¥31,000 | None needed |
| ICE Ban Year | 2035 (CA) | 2035 (EU-wide) | 2035 (target) | 2025 (achieved) |
| CO₂ Fleet Target | 82g/mi (2026) | 93.6g/km | 4.0L/100km | N/A |
| Charging Investment | $7.5B (NEVI) | €2.9B (AFIR) | ¥31B/yr | €1.2B |
| VAT Exemption | No | Partial | Yes (2026) | Yes (full) |
Sources: US DOE, European Commission, MIIT China, Norwegian EV Association — 2026
7. EV Range Improvements by Segment
Range anxiety — the fear of running out of charge before reaching a destination — has been the most cited barrier to EV adoption. In 2026, this concern is rapidly becoming obsolete. The average range of a new EV sold globally has increased to 312 miles (502 km), up from 248 miles in 2023. More importantly, the entry-level EV segment — vehicles priced under $30,000 — now offers an average range of 240 miles, sufficient for the vast majority of daily driving needs.
Average EV Range by Segment 2022 vs 2024 vs 2026 (miles)
Source: EPA, WLTP, NEDC combined data; ICCT EV Range Analysis 2026
The luxury EV segment leads with an average range of 520 miles in 2026, with the Mercedes EQS 680 achieving a class-leading 620 miles on a single charge. Mid-size EVs — the largest volume segment — average 420 miles, while compact EVs average 340 miles. Even electric pickup trucks, which historically struggled with range due to their weight and aerodynamic drag, now average 380 miles.
8. Environmental Impact & Emissions Savings
The global EV fleet of 95 million vehicles is estimated to have displaced 1.8 billion barrels of oiland avoided 680 million tonnes of CO₂ equivalent in 2025, according to the IEA. This represents approximately 1.8% of global transport emissions — a significant but still modest contribution given that transport accounts for 24% of global CO₂ emissions.
The lifecycle emissions of an EV depend critically on the carbon intensity of the electricity grid. In 2026, the global average grid carbon intensity has fallen to 412g CO₂/kWh (from 490g in 2020), meaning the average EV now produces approximately 60% fewer lifecycle emissions than an equivalent petrol car. In countries with high renewable energy shares — Norway (98% hydro), France (75% nuclear), Sweden (83% renewables) — EVs produce over 90% fewer emissions than ICE vehicles.
🌍 Environmental Impact of the Global EV Fleet 2026
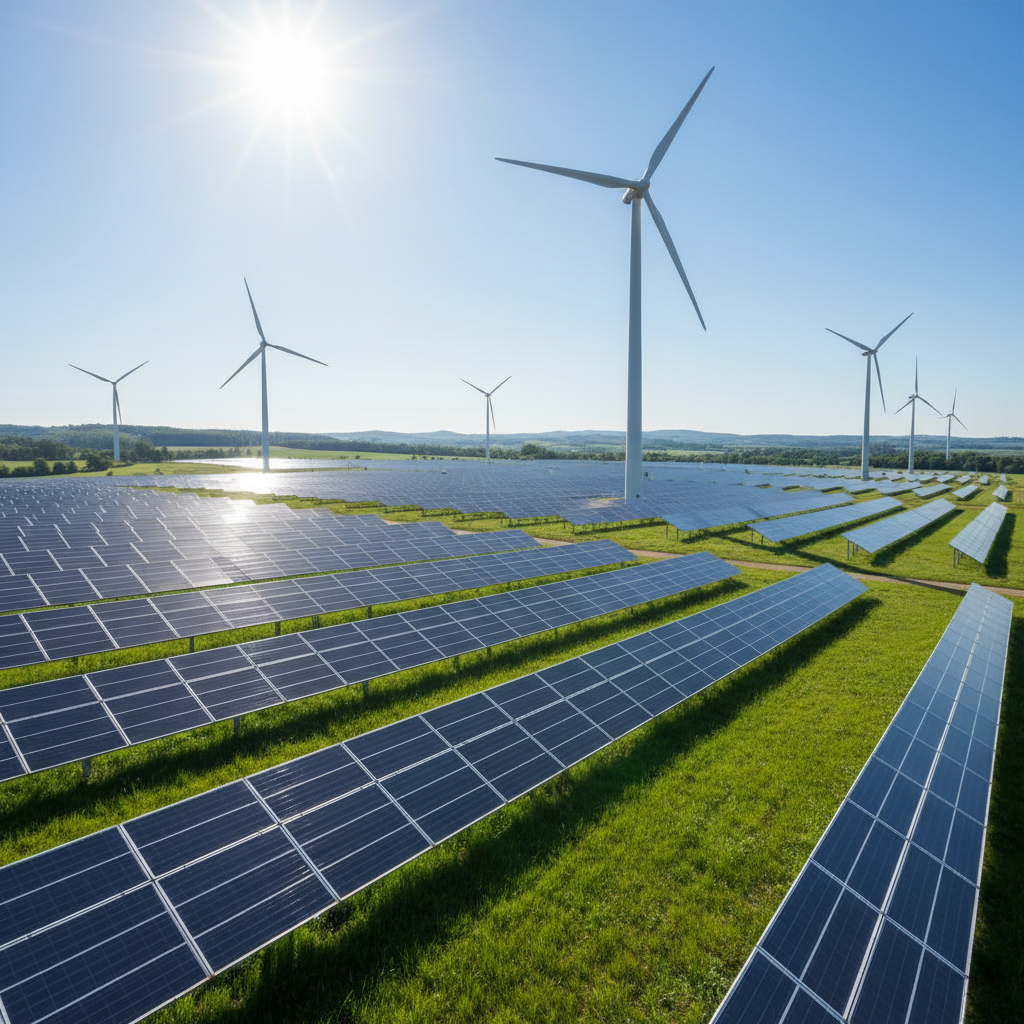
As renewable energy capacity grows, the environmental case for EVs strengthens further — EVs charged on 100% renewable electricity produce near-zero lifecycle emissions. Photo: Unsplash
9. EV Total Cost of Ownership 2026
The total cost of ownership (TCO) — encompassing purchase price, fuel/energy, maintenance, insurance, and depreciation — has reached parity with equivalent ICE vehicles in most major markets in 2026. In the United States, the 5-year TCO of the average EV is $46,200 compared to $47,250 for an equivalent petrol car, a difference of just $1,050 in favour of the EV.
The TCO advantage of EVs is most pronounced in fuel and maintenance savings. EV owners save an average of$1,800–$2,400 in maintenance costs over 5 years (no oil changes, fewer brake replacements due to regenerative braking, no transmission service) and $1,200–$2,000 in fuel costs annually, depending on local electricity and petrol prices.
| Cost Category | EV (5-year) | ICE (5-year) | EV Saving |
|---|---|---|---|
| Purchase Price (after incentives) | $38,400 | $32,800 | -$5,600 |
| Fuel / Energy | $4,200 | $10,800 | +$6,600 |
| Maintenance & Repairs | $2,800 | $5,200 | +$2,400 |
| Insurance | $7,400 | $6,800 | -$600 |
| Depreciation | $14,200 | $13,400 | -$800 |
| Registration & Taxes | $1,200 | $1,850 | +$650 |
| Total 5-Year TCO | $46,200 | $47,250 | +$1,050 |
Based on US market averages 2026. EV: mid-size BEV with $7,500 federal credit. ICE: equivalent mid-size petrol sedan. Sources: US DOE, ICCT, AAA, Consumer Reports 2026.
For a personalised cost comparison, use our EV vs Fuel Cost Calculator which factors in your local electricity rates, driving patterns, and available incentives. Also see our comprehensive EV Maintenance Costs vs Gas Cars guide.
10. Outlook: EV Forecast to 2030
The trajectory of EV adoption through 2030 is broadly positive, though the pace varies significantly by scenario. BloombergNEF's base case projects global EV sales reaching 42 million units by 2030, representing approximately 35% of global new car sales. The IEA's Stated Policies Scenario (STEPS) is more conservative at 38 million units, while the Announced Pledges Scenario (APS) projects 48 million units if all government commitments are met.
Key milestones expected by 2030 include: battery costs falling below $62/kWh (BNEF), the global public charging network expanding to over 15 million points (IEA), and EVs achieving purchase price parity with ICE vehicles in the mass-market segment without subsidies in all major markets. China is expected to reach60% EV market share by 2030, Europe 55%, and the United States 35%.
The most significant uncertainty in the 2030 outlook is the pace of charging infrastructure deployment, particularly in the United States and emerging markets. The IEA estimates that achieving net-zero transport emissions by 2050 requires 200 million public charging points globally by 2030 — a 44-fold increase from today's 4.5 million. This represents the single largest infrastructure challenge facing the EV transition.
📈 EV Market Forecast 2030
📚 Citations & Data Sources
- [1]International Energy Agency (IEA). (2026). Global EV Outlook 2026. Paris: IEA. https://www.iea.org/reports/global-ev-outlook-2026
- [2]BloombergNEF. (2026). Electric Vehicle Outlook 2026. New York: BloombergNEF. https://about.bnef.com/electric-vehicle-outlook/
- [3]International Council on Clean Transportation (ICCT). (2026). Global EV Policy Scorecard 2026. Washington DC: ICCT.
- [4]EV-Volumes. (2026). Global EV Sales Database Q1–Q2 2026. https://www.ev-volumes.com
- [5]BloombergNEF. (2026). Battery Price Survey 2026: Lithium-Ion Battery Pack Prices. New York: BNEF.
- [6]European Commission. (2026). CO₂ Emission Performance Standards for Cars and Vans. Brussels: EC.
- [7]US Department of Energy. (2026). Alternative Fuels Data Center: Electric Vehicle Charging Infrastructure. Washington DC: DOE.
- [8]Norwegian EV Association. (2026). Norwegian EV Statistics 2026. Oslo: Norsk elbilforening.
- [9]Ministry of Industry and Information Technology (MIIT). (2026). New Energy Vehicle Industry Development Plan 2026. Beijing: MIIT.
- [10]Consumer Reports. (2026). Annual Auto Reliability Survey 2026. Yonkers, NY: Consumer Reports.
Advertisement