Global Car Maintenance Costs 2026: The Complete Country-by-Country Report
The average driver now spends $1,186 per year on car maintenance — up 74% since 2016. Parts inflation, technician shortages, and increasingly complex vehicles are driving costs to record highs. This report analyses maintenance spending across 14 countries, 14 brands, and every major repair category, with data from RepairPal, AAA, ADAC, and the Global Automotive Aftermarket Symposium.
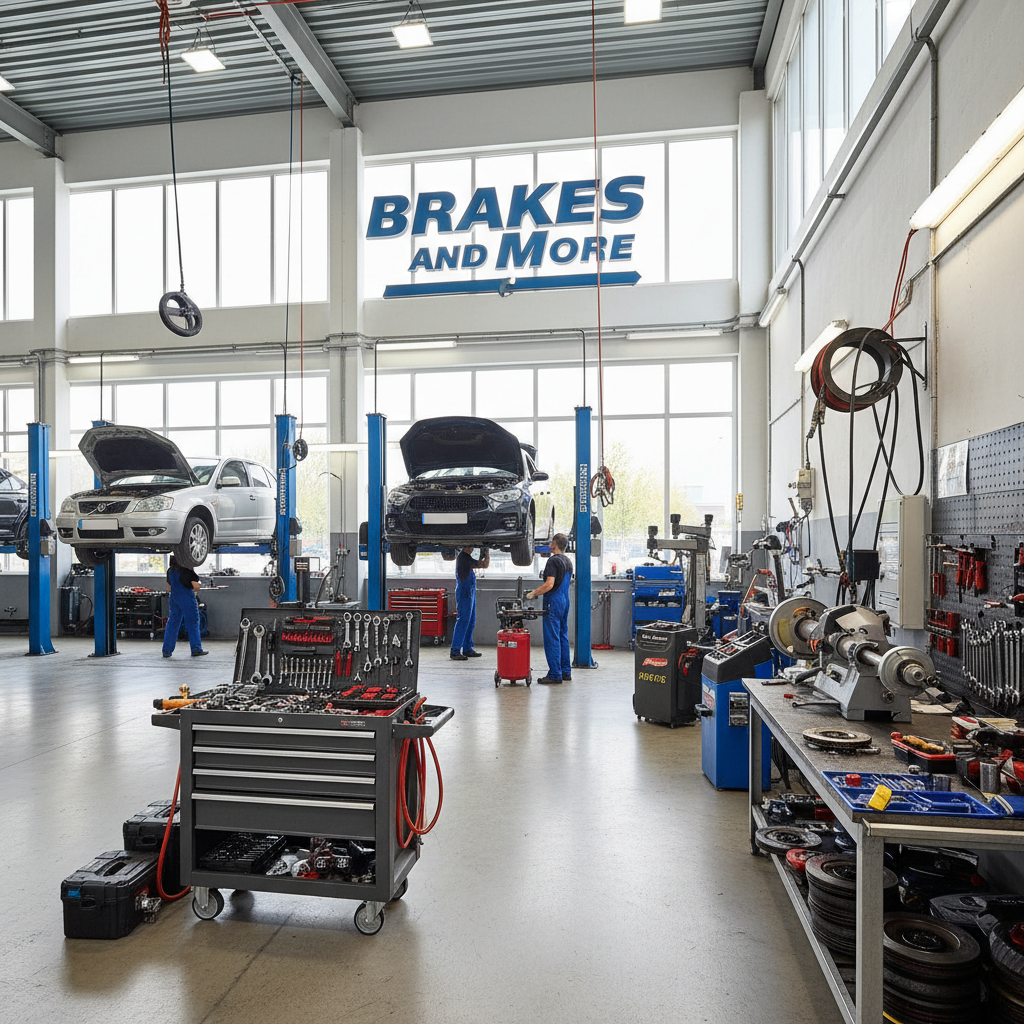
A professional mechanic services a vehicle at a modern repair facility. Photo: Unsplash
Advertisement
1. Global Car Maintenance Cost Trends 2016–2026
Global average annual car maintenance costs have risen from $680 in 2016 to $1,186 in 2026 — a 74% increase over a decade that outpaced both general inflation (42%) and wage growth (38%) in most developed economies. The sharpest acceleration occurred post-2021, when supply chain disruptions, semiconductor shortages, and a structural shortage of automotive technicians converged to create a perfect storm for repair costs.[1]
The United States leads developed nations with an average of $1,910 per year — nearly double the global average — driven by the world's highest automotive labor rates ($142/hr average), a litigious claims environment, and a vehicle fleet that skews heavily toward trucks and SUVs with higher maintenance requirements. European Union averages ($1,290) reflect strong consumer protection laws mandating regular inspections, while Asia-Pacific averages ($768) benefit from lower labor costs and a fleet dominated by smaller, simpler vehicles.[2]
Figure 1: Annual Car Maintenance Cost Trends by Region (USD, 2016–2026)
Sources: RepairPal, AAA, ADAC, Global Automotive Aftermarket Symposium (GAAS) 2026
The COVID-19 pandemic created a temporary dip in 2020 as lockdowns reduced driving and deferred maintenance. However, this deferred maintenance created a "repair debt" that contributed to the sharp 2021–2022 spike. Vehicles that missed scheduled services during 2020 required more extensive repairs in subsequent years, amplifying the cost surge.[3]
📊 Key Insight: Auto parts prices rose 28% from 2020–2026 according to the US Bureau of Labor Statistics Producer Price Index for motor vehicle parts. This is the largest 6-year parts inflation surge since the 1970s oil crisis.
2. Country-by-Country Maintenance Cost Breakdown
Maintenance costs vary by a factor of more than 8× between the most and least expensive countries. Norway tops the global rankings at $2,480/year — driven by the world's highest automotive labor rates (NOK 1,850/hr ≈ $185/hr), mandatory annual vehicle inspections (EU Kjøretøykontroll), and a premium vehicle fleet with high EV penetration (over 90% of new car sales are electric, but EVs still require expensive high-voltage servicing). At the other end, Indonesia averages just $290/year, reflecting labor rates of $14/hr and a fleet dominated by small motorcycles and compact cars.[4]
Figure 2: Annual Car Maintenance Cost by Country (USD, 2026)
Sources: ADAC (Germany), RAC (UK), AAA (US), NRMA (Australia), RepairPal, national transport ministries
| Country | Annual Cost | Labor Rate/hr | vs Global Avg | Key Driver |
|---|---|---|---|---|
| 🇳🇴 Norway | $2,480 | $185 | +109% | Highest labor rates + mandatory inspections |
| 🇨🇭 Switzerland | $2,340 | $178 | +97% | Premium fleet, strict MFK inspections |
| 🇺🇸 United States | $1,910 | $142 | +61% | Truck/SUV dominance, technician shortage |
| 🇦🇺 Australia | $1,820 | $138 | +53% | Remote geography, import parts premium |
| 🇬🇧 United Kingdom | $1,740 | $132 | +47% | Annual MOT, aging fleet |
| 🇩🇪 Germany | $1,680 | $128 | +42% | TÜV inspections, premium brand fleet |
| 🇨🇦 Canada | $1,590 | $118 | +34% | Winter damage, salt corrosion |
| 🇫🇷 France | $1,420 | $108 | +20% | Contrôle technique, diesel legacy |
| 🇯🇵 Japan | $1,280 | $92 | +8% | Shaken inspection, quality parts |
| 🇰🇷 South Korea | $980 | $72 | -17% | Domestic parts supply, efficient shops |
| 🇧🇷 Brazil | $740 | $48 | -38% | High import tariffs offset by low labor |
| 🇲🇽 Mexico | $620 | $38 | -48% | Low labor, proximity to US parts |
| 🇮🇳 India | $380 | $18 | -68% | Very low labor, small vehicle fleet |
| 🇮🇩 Indonesia | $290 | $14 | -76% | Lowest labor rates, motorcycle-heavy fleet |
Japan's unique position is worth noting: despite being a high-income country with quality-focused culture, annual maintenance costs ($1,280) are significantly lower than comparable economies. Japan's mandatory Shaken inspection system (every 2 years) actually reduces long-term costs by catching issues early, and the dominance of domestic brands (Toyota, Honda, Nissan) with abundant local parts supply keeps costs competitive.[5]
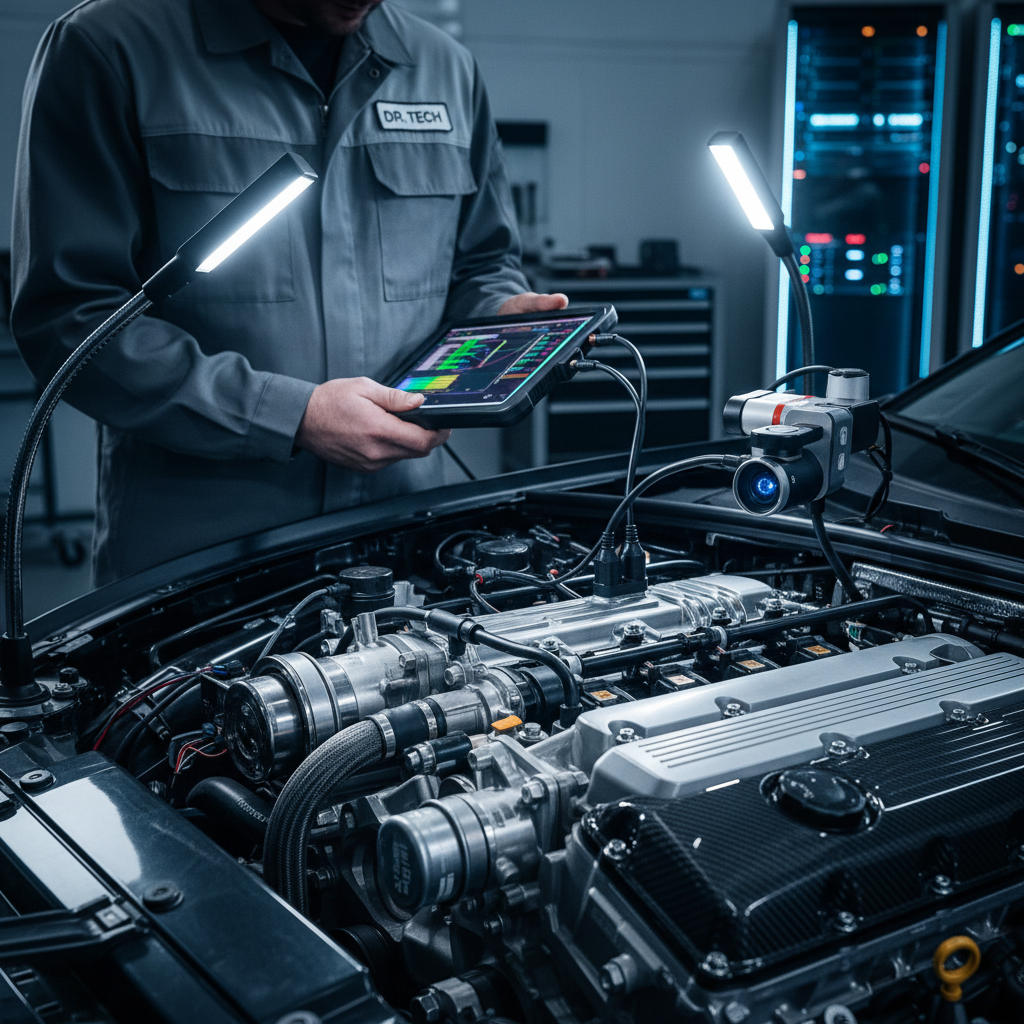
Vehicle inspection at a professional service centre. Photo: Unsplash
Advertisement
3. What Drives Maintenance Costs: Category Analysis
Understanding where maintenance money goes is essential for budgeting and prioritisation. Globally, tires and wheels represent the single largest maintenance category at 22% of total spend — a share that has grown from 18% in 2019 as tire prices surged 31% due to natural rubber supply constraints and the heavier weight of modern SUVs and EVs accelerating wear rates.[6]
Brake system maintenance (18%) remains the second-largest category, though this is shifting as EVs with regenerative braking systems reduce brake wear by 40–60%. Engine and oil services (16%) are declining as a share due to extended oil change intervals (now 7,500–10,000 miles for synthetic oil) and the growing EV fleet eliminating this category entirely for electric vehicle owners.
Figure 3: Global Maintenance Spend by Category (2026)
Source: GAAS 2026, RepairPal, AutoMD
Common Repair Costs (US, 2026)
The Electrical & Battery Surge
Electrical and battery-related maintenance has grown from 6% of total spend in 2019 to 11% in 2026 — the fastest-growing category. Modern vehicles contain 150+ electronic control units (ECUs), advanced driver-assistance systems (ADAS), and increasingly complex infotainment systems. ADAS calibration alone after a windshield replacement now costs $400–$1,200, compared to $150–$200 for a simple windshield swap a decade ago. This "technology tax" is expected to push electrical maintenance to 16% of total spend by 2030.[7]
4. Brand Reliability & Maintenance Cost Rankings
Brand choice is the single most impactful decision a consumer can make for long-term maintenance costs. The difference between the cheapest and most expensive brands to maintain is $1,352 per year — or $13,520 over a 10-year ownership period. This is often larger than the price premium between a budget and luxury vehicle.[8]
RepairPal's 2026 annual reliability report, based on 27 million repair orders across 35,000 shops, ranks Honda as the most affordable brand to maintain at $428/year, narrowly edging Toyota ($441/year). Both Japanese brands benefit from decades of reliability engineering, abundant parts availability, and a global network of trained technicians. At the other extreme, Land Rover ($1,780/year) and Jaguar ($1,640/year) top the expensive-to-maintain list, with owners reporting that even routine services can cost $400–$800 at authorised dealerships.
Figure 4: Annual Maintenance Cost vs Reliability Score by Brand (2026)
Source: RepairPal 2026 Annual Reliability Report (27M repair orders, 35,000 shops)
The German premium brands (BMW, Mercedes-Benz, Audi) present a particularly interesting case. Their higher maintenance costs stem from three factors: proprietary parts that command 40–80% premiums over aftermarket alternatives, complex engineering that requires specialist tools and training, and a dealer-centric service model that limits competition. A BMW 3 Series oil change at an authorised dealer costs $180–$280 vs $85–$120 for a comparable Toyota Camry service.[9]
Cheapest Individual Models to Maintain (2026, US data)
Advertisement
5. EV vs Gas: The Maintenance Cost Reality
Electric vehicles have fundamentally disrupted the maintenance cost equation. With no oil changes, no spark plugs, no timing belts, and significantly reduced brake wear thanks to regenerative braking, EVs eliminate or dramatically reduce several major maintenance categories. The US Department of Energy estimates EV owners save $900–$1,200 per year on maintenance compared to equivalent gasoline vehicles — a figure that compounds significantly over a 10-year ownership period.[10]
Figure 5: EV vs Gas Annual Maintenance Cost by Category (USD, 2026)
Sources: US DOE, Consumer Reports, AAA EV Ownership Study 2026
However, the EV maintenance picture is not uniformly positive. Tire costs are 15–20% higher for EVs due to the additional weight of battery packs (adding 400–900 lbs vs equivalent gas vehicles) and the instant torque delivery that accelerates wear. Premium EV-specific tires (required for many models due to low rolling resistance requirements) cost $180–$280 each vs $120–$200 for standard tires.[11]
The most significant EV maintenance wildcard remains high-voltage battery replacement. While most manufacturers offer 8-year/100,000-mile battery warranties, out-of-warranty replacements cost $8,000–$20,000 depending on the vehicle. As the first generation of EVs ages out of warranty (2024–2028), this will become an increasingly significant cost factor. However, battery degradation data from Tesla, Nissan, and Chevrolet suggests most batteries retain 80%+ capacity at 150,000 miles, making full replacement less common than feared.[12]
✅ EV Maintenance Advantages
- • No oil changes: saves $85–$140/service
- • No spark plugs: saves $120–$280 every 60k mi
- • No timing belt: saves $400–$900 every 90k mi
- • Reduced brake wear: 40–60% less brake service
- • No transmission fluid: saves $140–$280 every 30k mi
- • Fewer moving parts: 20 vs 2,000+ in gas engine
⚠️ EV Maintenance Challenges
- • Higher tire costs: +15–20% due to weight/torque
- • Battery replacement: $8,000–$20,000 if needed
- • ADAS recalibration: $400–$1,200 per incident
- • Fewer qualified technicians globally
- • 12V battery replacement: $180–$320 every 3–5 yrs
- • Thermal management system: $800–$2,400 if failed
For related analysis, see our Global Vehicle Pollution Report 2026 and our comprehensive EV vs Fuel Cost Calculator to model your specific scenario.
6. Labor Rate Comparison: 11 Countries
Automotive labor rates are the primary driver of maintenance cost differences between countries, accounting for 55–65% of total service bills. The global range is extraordinary: from $185/hr in Norway to $14/hr in Indonesia — a 13× difference that explains most of the country-level cost variation seen in Section 2.[13]
The United States faces a structural technician shortage that is accelerating labor rate inflation. The US Bureau of Labor Statistics projects a shortfall of 80,000 automotive service technicians by 2028, driven by an aging workforce (median age 39), insufficient vocational training pipeline, and competition from technology sectors offering higher wages. This shortage is already pushing independent shop rates to $120–$160/hr in major metropolitan areas, with dealer rates reaching $180–$220/hr in cities like San Francisco, New York, and Boston.[14]
Figure 6: Automotive Labor Rates by Country (USD/hr, 2026)
Sources: ADAC, RAC, AAA, NRMA, national automotive associations, IMF PPP adjustments
The EV Technician Premium
EV-certified technicians command a 25–40% labor rate premium over standard automotive technicians. High-voltage system work requires specialized training (typically 200+ hours), expensive personal protective equipment, and specialized diagnostic tools costing $15,000–$50,000 per shop. As EV penetration grows, this premium is expected to persist through at least 2030 as training pipelines catch up with demand. In Norway, where EVs represent 90%+ of new sales, EV-certified technicians already earn NOK 2,200/hr ($220/hr) vs NOK 1,850/hr ($185/hr) for standard work.
Advertisement
7. Most Expensive Car Repairs in 2026
While routine maintenance is predictable and budgetable, major repairs represent the financial wildcard of car ownership. Understanding the most expensive repair categories helps owners make informed decisions about extended warranties, emergency funds, and vehicle replacement timing.[15]
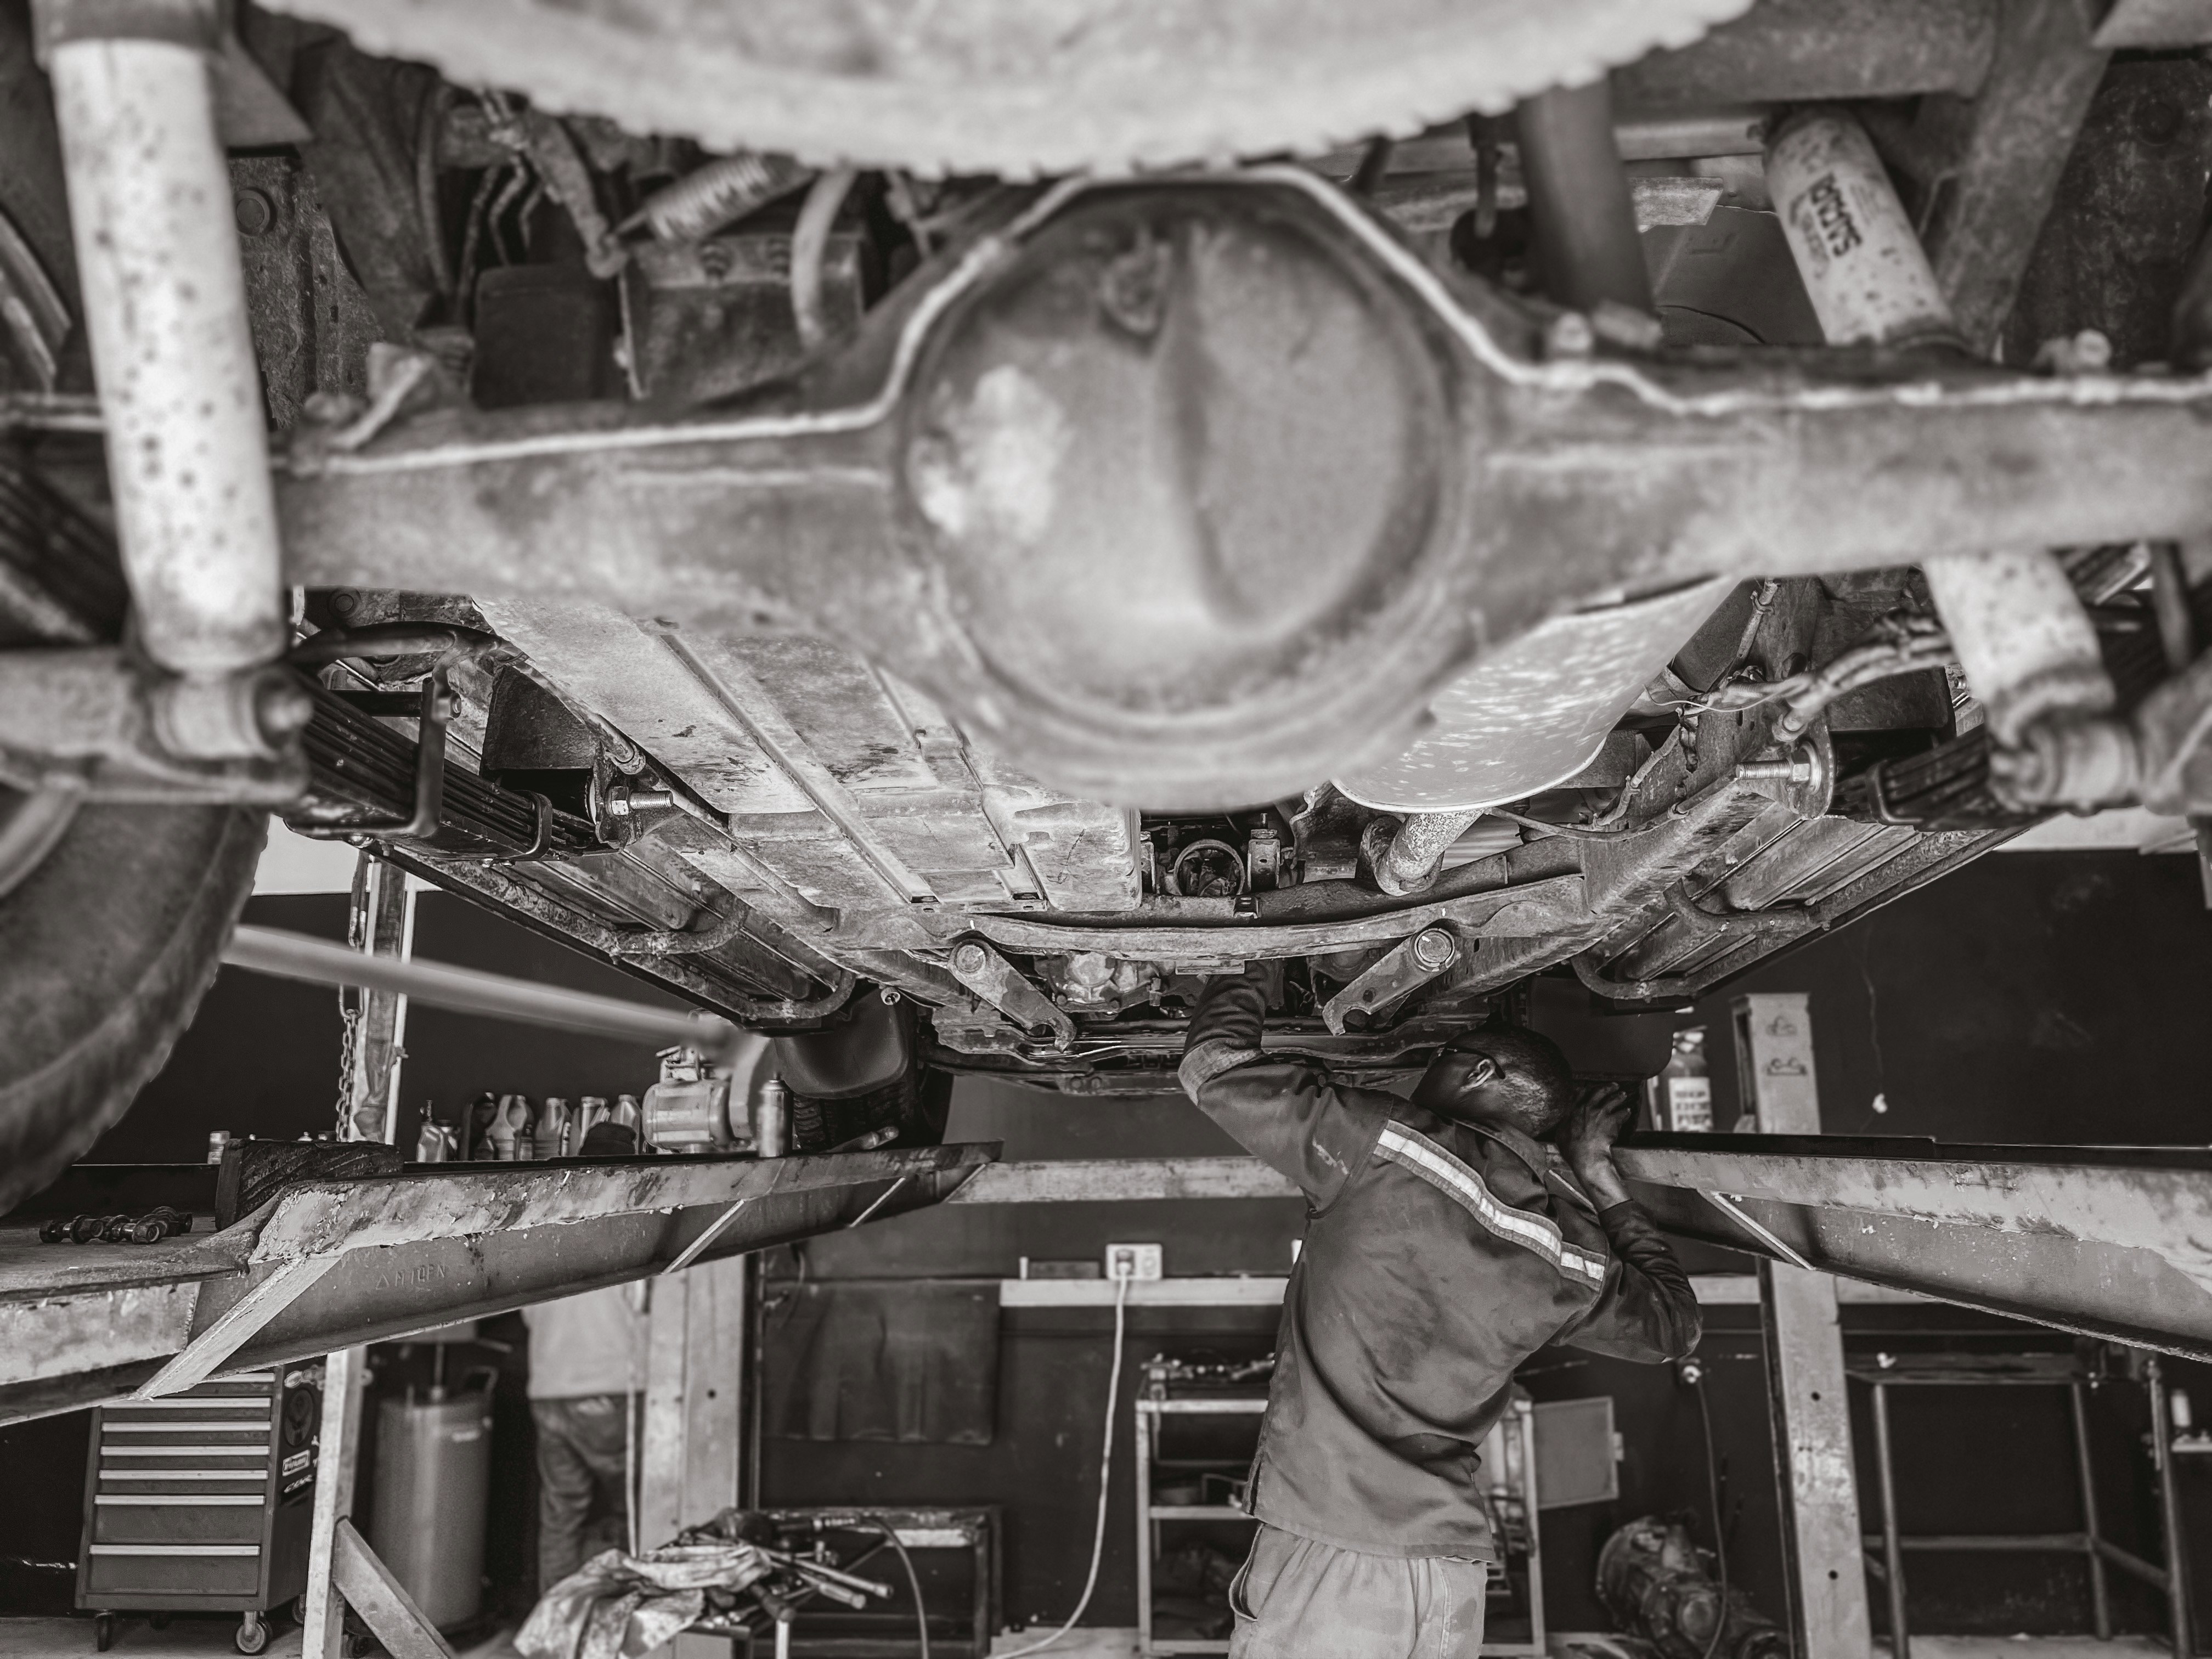
Engine replacement — the most expensive common repair. Photo: Unsplash
| Repair | Cost Range (US) | Avg Frequency | Warning Signs |
|---|---|---|---|
| EV Battery Replacement | $8,000–$20,000 | Rare (8–15 yrs) | Rapid range loss, BMS warnings |
| Engine Replacement | $4,500–$8,000 | Rare (15+ yrs) | Knocking, smoke, oil consumption |
| Transmission Replacement | $3,800–$7,200 | Every 150–200k mi | Slipping, delayed engagement |
| Hybrid Battery Pack | $2,500–$8,000 | Every 10–15 yrs | MPG drop, battery warning light |
| Turbocharger | $1,800–$4,000 | Every 100–150k mi | Boost loss, oil burning smell |
| Head Gasket | $1,500–$3,500 | Every 100–200k mi | White smoke, coolant loss |
| Catalytic Converter | $1,500–$3,200 | Every 100–150k mi | P0420 code, rotten egg smell |
| ADAS Recalibration | $400–$1,200 | After any collision | Camera/radar warning lights |
| AC Compressor | $800–$1,800 | Every 100–150k mi | Warm air, clicking noise |
| Timing Chain/Belt | $800–$1,600 | Every 60–100k mi | Rattling, rough idle |
The emergence of ADAS recalibration as a major cost category is one of the most significant shifts in automotive repair economics. Modern vehicles with forward-facing cameras, radar sensors, and LiDAR systems require precise recalibration after any collision, windshield replacement, or even suspension work. The equipment required for this calibration (static targets, dynamic road testing) costs shops $15,000–$80,000, and these costs are passed directly to consumers. Insurance claims now routinely include $600–$1,200 for ADAS recalibration that didn't exist as a line item five years ago.[16]
For a comprehensive view of total ownership costs beyond maintenance, see our True Cost of Car Ownership guide and our Total Cost of Ownership Calculator.
8. How to Reduce Your Car Maintenance Costs
With global maintenance costs at record highs, strategic cost management has never been more important. The following evidence-based strategies can reduce annual maintenance spending by $400–$1,400 per year without compromising vehicle reliability or safety.
1. Follow the Manufacturer Schedule (Not the Dealer)
Modern synthetic oils last 7,500–10,000 miles. Dealers often recommend 3,000-mile changes to generate revenue. Following the actual manufacturer schedule saves $120–$200/year on oil changes alone.
Save: $120–$200/yr2. Use Independent Shops for Non-Warranty Work
Independent shops charge 30–50% less than dealerships for identical work. Use dealers only for warranty repairs and recalls. A $280 dealer oil service costs $85–$120 at a reputable independent shop.
Save: $300–$600/yr3. Rotate Tires Every 5,000 Miles
Regular rotation extends tire life by 20–30%, saving $120–$360 per tire set. Combined with proper inflation (reduces wear by 15%), this is the highest-ROI maintenance habit.
Save: $150–$400/yr4. Use OBD-II Diagnostic Tools
A $25–$80 OBD-II scanner lets you read diagnostic codes before visiting a shop, preventing $150–$300 diagnostic fees. Apps like Torque Pro and Car Scanner provide real-time data.
Save: $150–$300/yr5. Get Multiple Quotes for Major Repairs
RepairPal data shows price variation of 40–80% for identical repairs between shops in the same city. For any repair over $300, get at least 3 quotes. Online platforms like RepairPal and AutoMD provide fair price estimates.
Save: $200–$600/yr6. Address Small Issues Before They Become Big
A $25 coolant flush prevents a $1,500 head gasket repair. A $60 brake inspection prevents a $800 rotor replacement. Preventive maintenance has a 5–10× ROI vs reactive repairs.
Save: $400–$1,400/yrThe Extended Warranty Question
Extended warranties (vehicle service contracts) are a $40 billion industry in the US alone. Consumer Reports analysis of 8,000+ warranty claims found that 55% of extended warranty holders never use them, and the average payout for those who do is $1,200 — less than the average $1,800 cost of the warranty. Extended warranties make financial sense primarily for: (1) vehicles with known reliability issues (certain German luxury brands), (2) buyers who cannot absorb a $3,000+ unexpected repair, and (3) high-mileage vehicles (100,000+ miles) approaching the end of factory warranty coverage.
For budget-conscious buyers, our analysis of why cheap cars often cost more and our budget car cost breakdown provide additional context for making cost-effective vehicle decisions.
9. Key Takeaways
Sources & Citations
- [1]Global Automotive Aftermarket Symposium (GAAS). (2026). Global Aftermarket Report 2026. GAAS Annual Publication.
- [2]AAA. (2026). Your Driving Costs: How Much Are You Really Paying to Drive? AAA Newsroom.
- [3]US Bureau of Labor Statistics. (2026). Consumer Price Index: Motor Vehicle Maintenance and Repair. BLS.gov.
- [4]ADAC. (2026). Kfz-Kosten 2026: Betriebskosten im Vergleich. ADAC Motorwelt.
- [5]Japan Automobile Dealers Association. (2026). Vehicle Inspection and Maintenance Cost Survey 2026. JADA.
- [6]Tire Industry Association. (2026). Global Tire Market Report 2026. TIA Annual Review.
- [7]McKinsey & Company. (2026). The Future of Automotive Aftermarket. McKinsey Center for Future Mobility.
- [8]RepairPal. (2026). Annual Reliability Report 2026: 27 Million Repair Orders Analyzed. RepairPal.com.
- [9]Consumer Reports. (2026). Car Reliability Survey 2026: 300,000 Vehicles Rated. ConsumerReports.org.
- [10]US Department of Energy. (2026). Electric Vehicle Benefits and Considerations. Energy.gov/eere.
- [11]Consumer Reports. (2026). EV Tire Wear Study: Why Electric Vehicles Need New Tires Sooner. ConsumerReports.org.
- [12]Tesla, Inc. (2026). Battery Degradation Data: 2M+ Vehicles Analyzed. Tesla Annual Impact Report.
- [13]International Labour Organization. (2026). Automotive Sector Wage Report 2026. ILO Geneva.
- [14]US Bureau of Labor Statistics. (2026). Occupational Outlook Handbook: Automotive Service Technicians. BLS.gov.
- [15]AutoMD. (2026). Most Expensive Car Repairs 2026: National Cost Survey. AutoMD.com.
- [16]CCC Intelligent Solutions. (2026). Crash Course: ADAS Calibration and Repair Costs. CCC Annual Report.
10. Frequently Asked Questions
Advertisement