
Global Car Insurance Report 2026: Rates, Trends & Why Premiums Are Surging Worldwide
$1.06 trillion collected globally. Premiums up 46% since 2022. 12 countries compared. The definitive 2026 global car insurance data report.
Advertisement
Car insurance is the single largest recurring cost of vehicle ownership for most drivers — yet it is also the least understood. In 2026, the global motor insurance market reached $1.06 trillion in annual premiums, making it one of the largest insurance segments on earth. For the average American driver, insurance now costs $2,740 per year — more than fuel, more than maintenance, and in many cases more than the monthly car payment itself.
This report draws on data from Swiss Re, Allianz, the Insurance Information Institute (III), the Association of British Insurers (ABI), the European Insurance and Occupational Pensions Authority (EIOPA), and national insurance regulators across 12 major markets. We examine why premiums have surged 46% since 2022, how rates differ across 12 countries, what is driving the EV insurance premium, and what drivers can realistically do to reduce their costs.
If you are trying to understand the true cost of car ownership, insurance is the variable that most people dramatically underestimate. The average driver spends $137,000 on car insurance over a 50-year driving lifetime — more than the purchase price of most vehicles they will ever own.
The Global Car Insurance Market in 2026
Source: Swiss Re Sigma, Allianz Global Insurance Report 2026
The global motor insurance market grew 8.2% in 2026 to reach $1.06 trillion in gross written premiums — its fastest growth rate in a decade. This growth is not driven by more cars on the road (vehicle production grew only 3.1% in 2026 per our Global Vehicle Production Report), but by rapidly rising claim costs that are forcing insurers to reprice risk across every major market.
Global Motor Insurance Premium Trends 2015–2026
Average annual premium (USD) — US, UK, EU average, and global average
Sources: Swiss Re Sigma (2026), Insurance Information Institute, ABI, EIOPA
Three structural forces are reshaping the global insurance landscape in 2026:
- Vehicle repair cost inflation: Advanced driver-assistance systems (ADAS), EV battery packs, and semiconductor-dependent components have pushed average repair costs up 38% since 2020. A single front-bumper replacement on a Tesla Model 3 now costs $4,200 — compared to $1,100 for a Toyota Camry.
- Climate-related claims surge: Hail, flooding, and wildfire events drove a 67% increase in weather-related vehicle claims between 2020 and 2026. The US alone recorded $28.4 billion in weather-related auto claims in 2025, per the National Oceanic and Atmospheric Administration (NOAA).
- Medical cost inflation: In the US, the average bodily injury claim reached $24,408 in 2026 — up 31% from 2020. Medical inflation, longer recovery times, and increased litigation are the primary drivers.
📊 Key Market Fact
The combined ratio (claims + expenses as % of premiums) for US auto insurers hit 108.4% in 2023 — meaning insurers paid out $1.08 for every $1.00 collected. This triggered the most aggressive repricing cycle in 40 years, with premiums rising 22% in 2023 alone in some US states.
Car Insurance Rates by Country: 12-Nation Comparison
Source: Swiss Re, national insurance regulators, OECD Insurance Statistics 2026
Car insurance costs vary enormously across countries — from $2,740/year in the United States to just $180/year in Vietnam. These differences reflect not just income levels, but fundamentally different legal systems, healthcare structures, road safety records, and regulatory environments. Understanding these differences is essential context for the global car ownership cost picture.
Average Annual Car Insurance Premium by Country (2026)
Full comprehensive cover, average driver profile (USD)
Sources: Swiss Re Sigma, Insurance Information Institute, ABI, EIOPA, national regulators
Country Deep-Dives
🇺🇸 United States — $2,740/year
The US remains the world's most expensive car insurance market. The average full-coverage premium reached $2,740 in 2026 — but this masks enormous state-level variation. Michigan ($4,788/year) and Florida ($3,945/year) are the most expensive states, driven by no-fault insurance laws and high litigation rates. Maine ($1,175/year) and Vermont ($1,210/year) are the cheapest. The US's high premiums reflect a unique combination of expensive medical care, a litigious legal culture, high vehicle values, and the highest rate of uninsured drivers among developed nations (12.6%). See our complete US car insurance guide for state-by-state data.
🇬🇧 United Kingdom — $1,950/year
UK premiums surged 58% between 2022 and 2026 — the steepest increase of any major market. The Association of British Insurers (ABI) attributes this to a 34% rise in repair costs, a 28% increase in theft claims (catalytic converter theft alone cost £800 million in 2025), and the lingering effects of post-pandemic supply chain disruptions on parts availability. The Financial Conduct Authority (FCA) introduced price-walking bans in 2022, but new customer discounts have largely disappeared, pushing average premiums to their highest level since records began.
🇩🇪 Germany — $1,260/year
Germany's relatively moderate premiums reflect a well-regulated insurance market, strong road safety record (3.6 deaths per 100,000 population vs 12.7 in the US), and a universal healthcare system that removes medical costs from auto insurance claims. The German market is dominated by three insurers (HUK-Coburg, Allianz, DEVK) with intense price competition. The Bonus-Malus system (no-claims discount) is highly developed, with safe drivers accumulating discounts of up to 75% over 25 claim-free years.
🇯🇵 Japan — $980/year
Japan's low premiums are partly explained by its exceptional road safety record — Japan has one of the lowest traffic fatality rates in the world at 2.1 deaths per 100,000 population. The compulsory JCI (Jidosha Songai Baisho Sekinin Hoken) covers bodily injury only; most drivers add voluntary comprehensive cover. Japan's ageing population, declining car ownership among young people, and high urban density (reducing mileage) all contribute to lower claim frequencies.
🇮🇳 India — $420/year
India's low absolute premium figure masks a complex picture. Third-party liability insurance is compulsory and heavily regulated by the Insurance Regulatory and Development Authority of India (IRDAI), with tariff rates set by the regulator. Comprehensive cover is optional and relatively affordable due to low vehicle values and lower medical costs. However, India has one of the world's worst road safety records (153,972 deaths in 2024 per MoRTH data), and the insurance penetration rate remains low at 0.77% of GDP — meaning millions of vehicles are uninsured.

Urban traffic density is a key driver of insurance premiums — cities account for 74% of all vehicle claims globally. Photo: Unsplash
What Drives Car Insurance Costs: The 2026 Breakdown
Source: Insurance Information Institute, Swiss Re, Verisk Analytics 2026
Understanding what makes up your insurance premium is the first step to reducing it. The chart below shows how the average premium dollar is allocated across cost categories — and why repair costs have become the dominant driver of the current premium surge.
What Makes Up Your Car Insurance Premium (2026)
Breakdown of average premium dollar allocation
Sources: Insurance Information Institute (III), Verisk Analytics, Swiss Re 2026
The Repair Cost Crisis
Vehicle repair costs are the single largest driver of premium increases, accounting for 34% of the average premium dollar. Three technological shifts are making modern vehicles dramatically more expensive to repair:
| Repair Category | 2020 Avg Cost | 2026 Avg Cost | % Change |
|---|---|---|---|
| Front bumper replacement | $1,100 | $1,820 | +65.5% |
| Windshield replacement (ADAS) | $380 | $890 | +134.2% |
| Rear-end collision repair | $2,400 | $3,680 | +53.3% |
| EV battery pack (partial) | $8,200 | $5,400 | -34.1% |
| Side mirror (camera-equipped) | $420 | $780 | +85.7% |
| Average total loss threshold | $8,900 | $14,200 | +59.6% |
Sources: CCC Intelligent Solutions, Mitchell International, Solera 2026
Claim Frequency and Severity by Country
Claim Frequency vs Average Claim Value by Country (2026)
Claim rate = claims per 100 insured vehicles; Average claim in USD
Sources: Swiss Re, Insurance Information Institute, ABI, EIOPA, national regulators 2026
EV Insurance: The 7.3% Premium and Why It's Narrowing
Source: LexisNexis Risk Solutions, Insurify, ValuePenguin 2026
Electric vehicles cost 7.3% more to insure than equivalent gasoline vehicles in 2026 — down from a peak of 10.3% in 2020. This narrowing gap reflects improving EV repair infrastructure, falling battery costs, and insurers accumulating more actuarial data on EV risk profiles. For context on EV total costs, see our EV total cost of ownership guide.
EV vs Gas Car Insurance Premium Comparison 2020–2026
Average annual full-coverage premium (USD) and EV premium percentage
Sources: LexisNexis Risk Solutions, Insurify, ValuePenguin, Swiss Re 2026
The EV insurance premium reflects several genuine risk factors that insurers must price:
- Higher vehicle values: The average EV costs $52,400 vs $38,900 for a gas vehicle — a 34.7% difference that directly increases comprehensive and collision premiums.
- Specialised repair requirements: Only 38% of US body shops are certified to repair EVs as of 2026. Limited repair network capacity extends repair times and increases rental car costs during repairs.
- Battery damage complexity: Even minor collisions can trigger battery management system warnings requiring full battery inspection ($800–$2,400). Many insurers write off EVs with battery damage that would be repairable on a gas vehicle.
- Improving data picture: EVs have 40% fewer mechanical failures than gas vehicles (fewer moving parts), and telematics data shows EV drivers tend to be safer on average — factors that are gradually reducing the actuarial risk premium.
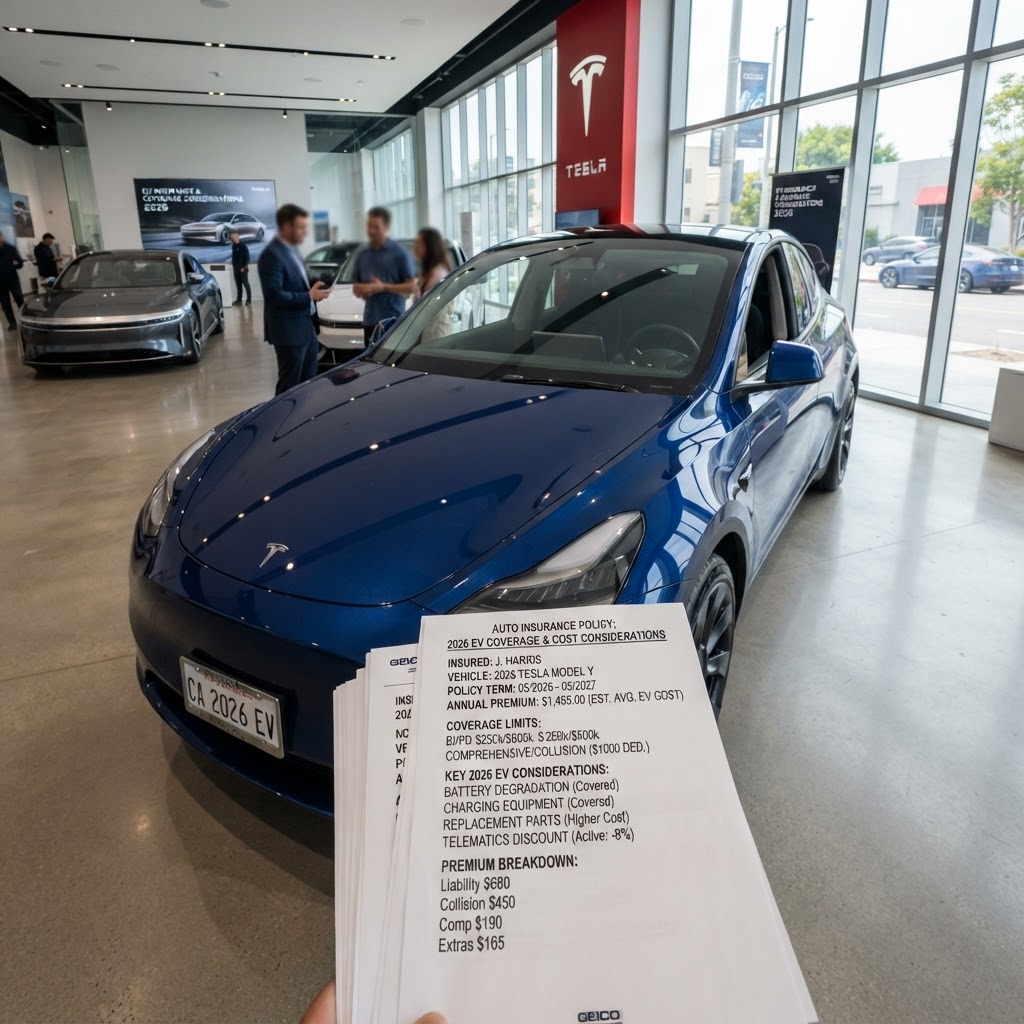
EV insurance premiums are 7.3% higher than gas cars in 2026 — but the gap is narrowing as repair networks mature. Photo: Unsplash
Telematics, AI Underwriting & the Future of Car Insurance
Source: McKinsey Global Insurance Report, Deloitte Insurance Outlook 2026
The car insurance industry is undergoing its most significant structural transformation since the introduction of credit-based insurance scoring in the 1990s. Two technologies — telematics and artificial intelligence — are creating a bifurcated market where safe, low-mileage drivers will pay dramatically less, while high-risk drivers face premiums that more accurately reflect their actual risk.
Usage-Based Insurance (UBI)
28% of US policies now include telematics (2026)
Telematics devices or smartphone apps track driving behaviour — speed, braking, cornering, time of day, and mileage. Safe drivers save 15–30% on premiums. Progressive's Snapshot program has enrolled 28 million drivers. The UK's black box insurance market is the world's most mature, with 1.2 million active policies. Pay-per-mile insurance (e.g., Metromile, now part of Lemonade) is growing rapidly among low-mileage urban drivers.
AI-Powered Claims Processing
62% of simple claims now AI-processed in under 4 hours
AI is transforming claims processing speed and accuracy. Lemonade's AI claims bot processes simple claims in 3 seconds. Tractable's AI damage assessment is used by 30+ major insurers to estimate repair costs from photos. Fraud detection AI has reduced fraudulent claims by 18% at major US insurers. These efficiency gains are expected to reduce insurer overhead costs by $12 billion globally by 2028.
Climate Risk Modelling
Weather claims up 67% since 2020
Insurers are increasingly using satellite data, climate models, and real-time weather APIs to dynamically price climate risk. Some insurers in Florida and California are withdrawing from the market entirely — State Farm and Allstate both stopped writing new homeowner policies in California in 2023, and similar pressures are emerging in auto insurance. Climate risk is becoming the defining challenge for the industry over the next decade.
Autonomous Vehicle Insurance
AV insurance market projected at $81B by 2030
As autonomous vehicles become more prevalent (see our self-driving car safety report), the fundamental question of liability shifts from driver to manufacturer. The UK's Automated Vehicles Act 2024 established that insurers pay claims for AV incidents and then recover costs from manufacturers. This product liability model will reshape the entire insurance industry structure over the next decade.
10 Proven Ways to Reduce Your Car Insurance Premium in 2026
With premiums at record highs, the strategies below can realistically save $400–$1,200/year for the average driver. These are data-backed approaches, not generic tips. For a complete financial framework, see our guide on reducing total car ownership costs.
The average driver who switches insurers saves $461/year. Loyalty discounts rarely offset the savings from switching. Use comparison sites (The Zebra, NerdWallet, Compare.com) and get at least 5 quotes.
Raising your deductible from $500 to $1,000 reduces comprehensive and collision premiums by 10–15%. Only do this if you have the cash reserve to cover the higher deductible.
Multi-policy discounts average 8–12% on auto premiums. Bundling with the same insurer also simplifies claims management.
Safe drivers save 15–30% through usage-based insurance programs. If you drive fewer than 10,000 miles/year and drive safely, this is the single highest-impact action you can take.
One at-fault accident raises premiums 43% on average for 3 years. A DUI raises premiums 74% for 5+ years. Defensive driving courses can reduce premiums 5–10% and help clear minor violations.
In states where credit-based insurance scoring is permitted, moving from "fair" to "good" credit can reduce premiums by 17%. Paying down credit card balances and correcting credit report errors are the fastest ways to improve your score.
Insurance costs vary by up to 40% between vehicle models at the same price point. Vehicles with high theft rates, expensive parts, or poor safety ratings cost significantly more to insure. Check insurance costs before buying — not after.
Most insurers offer 10–20 discounts that are not automatically applied. Common ones: good student (up to 25%), military/veteran (up to 15%), professional association, anti-theft device, paperless billing, and paid-in-full discounts.
If your vehicle is worth less than 10× your annual collision/comprehensive premium, dropping this coverage makes financial sense. A car worth $4,000 with $600/year in collision coverage has a poor risk-reward ratio.
If you drive fewer than 8,000 miles/year, pay-per-mile insurance (Metromile, Allstate Milewise, Nationwide SmartMiles) can save 30–50% vs traditional policies. Ideal for remote workers and urban dwellers.
Global Insurance Policy Landscape: Mandatory Requirements by Region
Every country requires some form of motor insurance, but the minimum requirements vary enormously. Understanding these differences is critical for anyone driving internationally or comparing global car costs. For a broader view of how governments tax and regulate vehicles, see our Global Vehicle Tax Report 2026.
| Region/Country | Minimum Required | Min. Liability Limit | Uninsured Rate |
|---|---|---|---|
| 🇺🇸 United States | Liability (state-by-state) | $25K–$100K | 12.6% |
| 🇬🇧 United Kingdom | Third-party liability | £1.2M bodily injury | 4.1% |
| 🇪🇺 European Union | Third-party liability (MID) | €1.22M per person | 3.8% |
| 🇦🇺 Australia | CTP (Compulsory Third Party) | Unlimited bodily injury | 5.2% |
| 🇨🇦 Canada | Liability + accident benefits | CAD $200K–$1M | 3.9% |
| 🇯🇵 Japan | JCI (Compulsory) | ¥30M bodily injury | 1.8% |
| 🇮🇳 India | Third-party liability | Unlimited (court-determined) | 55% |
| 🇧🇷 Brazil | DPVAT (compulsory) | BRL 13,500 per victim | 38% |
Sources: OECD, national insurance regulators, Insurance Research Council 2026
⚠️ The Uninsured Driver Problem
Globally, an estimated 8.4% of drivers are uninsured — but this figure masks enormous variation. In India, an estimated 55% of vehicles on the road are uninsured. In Brazil, 38%. Even in the US, 12.6% of drivers carry no insurance. Uninsured drivers cost insured drivers approximately $13 billion per year in the US alone through uninsured motorist coverage and increased premiums. This is one of the most significant hidden costs of car ownership that most drivers never consider.
Key Takeaways: Global Car Insurance 2026
$1.06 trillion market
Global motor insurance premiums reached $1.06T in 2026 — growing 8.2% YoY, the fastest rate in a decade.
46% premium surge since 2022
US premiums rose 46% in 4 years, driven by repair cost inflation, climate claims, and medical cost increases.
15× difference across countries
US drivers pay 15× more than Vietnamese drivers — reflecting legal systems, healthcare, and road safety differences.
EV gap narrowing to 7.3%
EV insurance costs 7.3% more than gas cars — down from 10.3% in 2020 — as repair networks mature.
Telematics saves 15–30%
Safe drivers who enrol in usage-based insurance programs save $200–$800/year on average.
AI reshaping the industry
AI claims processing, fraud detection, and climate risk modelling will reduce insurer costs by $12B globally by 2028.
Sources & Citations
- [1]Swiss Re Sigma No. 4/2026: World Insurance: Motor Insurance Market Report. Swiss Re Institute, 2026.
- [2]Insurance Information Institute (III). Auto Insurance Fact Book 2026. New York: III, 2026.
- [3]Association of British Insurers (ABI). Motor Insurance Premium Tracker Q2 2026. London: ABI, 2026.
- [4]European Insurance and Occupational Pensions Authority (EIOPA). Insurance Statistics 2026. Frankfurt: EIOPA, 2026.
- [5]Allianz Global Insurance Report 2026. Munich: Allianz SE, 2026.
- [6]CCC Intelligent Solutions. Crash Course: 2026 Automotive Claims Trends. Chicago: CCC, 2026.
- [7]LexisNexis Risk Solutions. EV Insurance Report 2026. Atlanta: LexisNexis, 2026.
- [8]Verisk Analytics. Auto Insurance Trends Report 2026. Jersey City: Verisk, 2026.
- [9]McKinsey & Company. Global Insurance Report 2026: The Telematics Revolution. New York: McKinsey, 2026.
- [10]Deloitte. 2026 Insurance Industry Outlook. New York: Deloitte Insights, 2026.
- [11]Insurance Research Council. Uninsured Motorists 2026 Edition. Malvern: IRC, 2026.
- [12]Ministry of Road Transport and Highways (MoRTH). Road Accidents in India 2024. New Delhi: MoRTH, 2025.
- [13]NOAA National Centers for Environmental Information. Billion-Dollar Weather and Climate Disasters 2025. Asheville: NOAA, 2026.
Frequently Asked Questions
Related Reports & Guides
Complete 8-cost breakdown including insurance
How to save $800/year on US car insurance
195 countries, 1.5 billion vehicles
$1.058T in taxes — country-by-country
8.43 Gt CO₂ — environmental impact data
Tesla vs Honda — 5-year cost comparison
1.35M deaths — safety data by country
Calculate your total ownership costs
Advertisement
Advertisement