Self-Driving Cars: Global Accident and Safety Statistics 2026
Autonomous vehicles logged 142.6 billion miles globally in 2026. Waymo's robotaxis record just 0.22 incidents per million miles — 19× safer than the average human driver. Here is the complete global data breakdown.
CarCostBreakdown
Senior Automotive Data Analyst
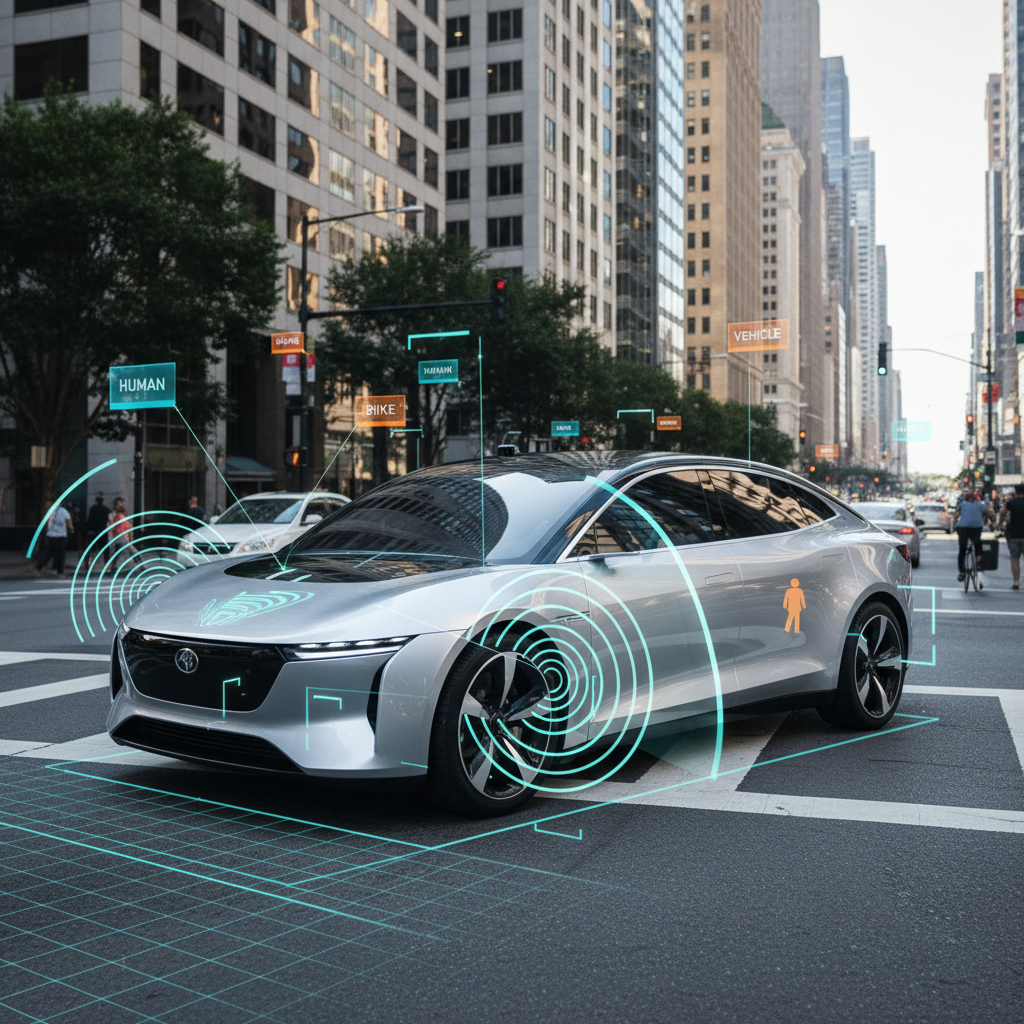
Autonomous vehicles are now logging over 142 billion miles annually worldwide. Photo: Unsplash
142.6B
AV Miles Logged (2026)
0.22
Waymo Incidents/1M mi
4.2
Human Incidents/1M mi
62
Countries with AV Laws
Advertisement
Table of Contents
- 1. The State of Autonomous Vehicles in 2026
- 2. Global AV Miles Logged: Growth Trajectory
- 3. Incident Rates by Autonomy Level
- 4. Leading AV Companies: Safety Comparison
- 5. Root Causes of AV Accidents
- 6. Country-by-Country Deployment & Regulation
- 7. ADAS vs Full Autonomy: Safety Spectrum
- 8. High-Profile AV Incidents: What We Learned
- 9. Regulatory Landscape: Global AV Laws 2026
- 10. The Road Ahead: AV Safety Projections to 2030
1. The State of Autonomous Vehicles in 2026
The autonomous vehicle (AV) industry reached a pivotal inflection point in 2026. After years of cautious pilot programmes and regulatory uncertainty, commercial robotaxi services now operate in over 40 cities across 12 countries. The global AV market — encompassing hardware, software, and services — is valued at $214 billion, up from $54 billion in 2022, according to McKinsey Global Institute estimates.
The SAE International autonomy scale, ranging from Level 0 (no automation) to Level 5 (full automation), provides the framework for understanding where the industry stands. In 2026, the vast majority of commercially deployed AVs operate at Level 4 — high automation within defined geographic zones (Operational Design Domains, or ODDs). True Level 5 vehicles capable of operating in any condition anywhere remain a research-stage concept.
The safety question is paramount. With 1.35 million people dying in road accidents globally each year — a figure explored in depth in our Global Road Accidents Report 2026 — the promise of autonomous vehicles is fundamentally a safety promise. The data in 2026 is increasingly compelling, but nuanced.
According to the NHTSA Standing General Order (SGO) reporting database, which mandates disclosure of AV incidents in the United States, autonomous and semi-autonomous vehicles were involved in 2,388 reported incidents between July 2021 and December 2025. However, context is everything: these vehicles collectively drove hundreds of billions of miles, and the incident rate per mile driven is dramatically lower than for human-operated vehicles.
"The data increasingly shows that where autonomous vehicles are deployed at scale, they are measurably safer than human drivers. The challenge is expanding that operational domain safely." — Dr. Missy Cummings, George Mason University, 2026
2. Global AV Miles Logged: Growth Trajectory
The total distance driven by autonomous vehicles globally has grown at a compound annual growth rate (CAGR) of 71% since 2019. In 2026, AVs collectively logged an estimated 142.6 billion miles worldwide, with China accounting for approximately 58% of that total, driven by the aggressive expansion of Baidu Apollo, WeRide, and Pony.ai.
Global AV Miles Logged (Billions), 2019–2026
Source: NHTSA SGO Database, MIIT China, European AV Alliance, 2026
The United States remains the leader in regulated, reported AV miles, with California's DMV reporting 11.8 million autonomous miles in 2025 from permitted operators alone — a figure that excludes Tesla's Autopilot and FSD data, which is not subject to the same reporting requirements. Waymo alone has surpassed 50 million fully driverless miles in its commercial operations across San Francisco, Phoenix, and Los Angeles.
China's AV mileage figures, while larger in aggregate, are harder to verify due to less standardised reporting. The Ministry of Industry and Information Technology (MIIT) reported that licensed AV test vehicles in China drove over 82 billion kilometres (approximately 51 billion miles) in 2025, with commercial robotaxi services in Wuhan, Beijing, and Shenzhen accounting for a growing share.
This scale of operation is critical for safety analysis. The more miles logged, the more statistically meaningful the incident data becomes. With 142+ billion miles in 2026, the AV industry now has a dataset large enough to draw robust safety conclusions — and those conclusions are broadly positive.
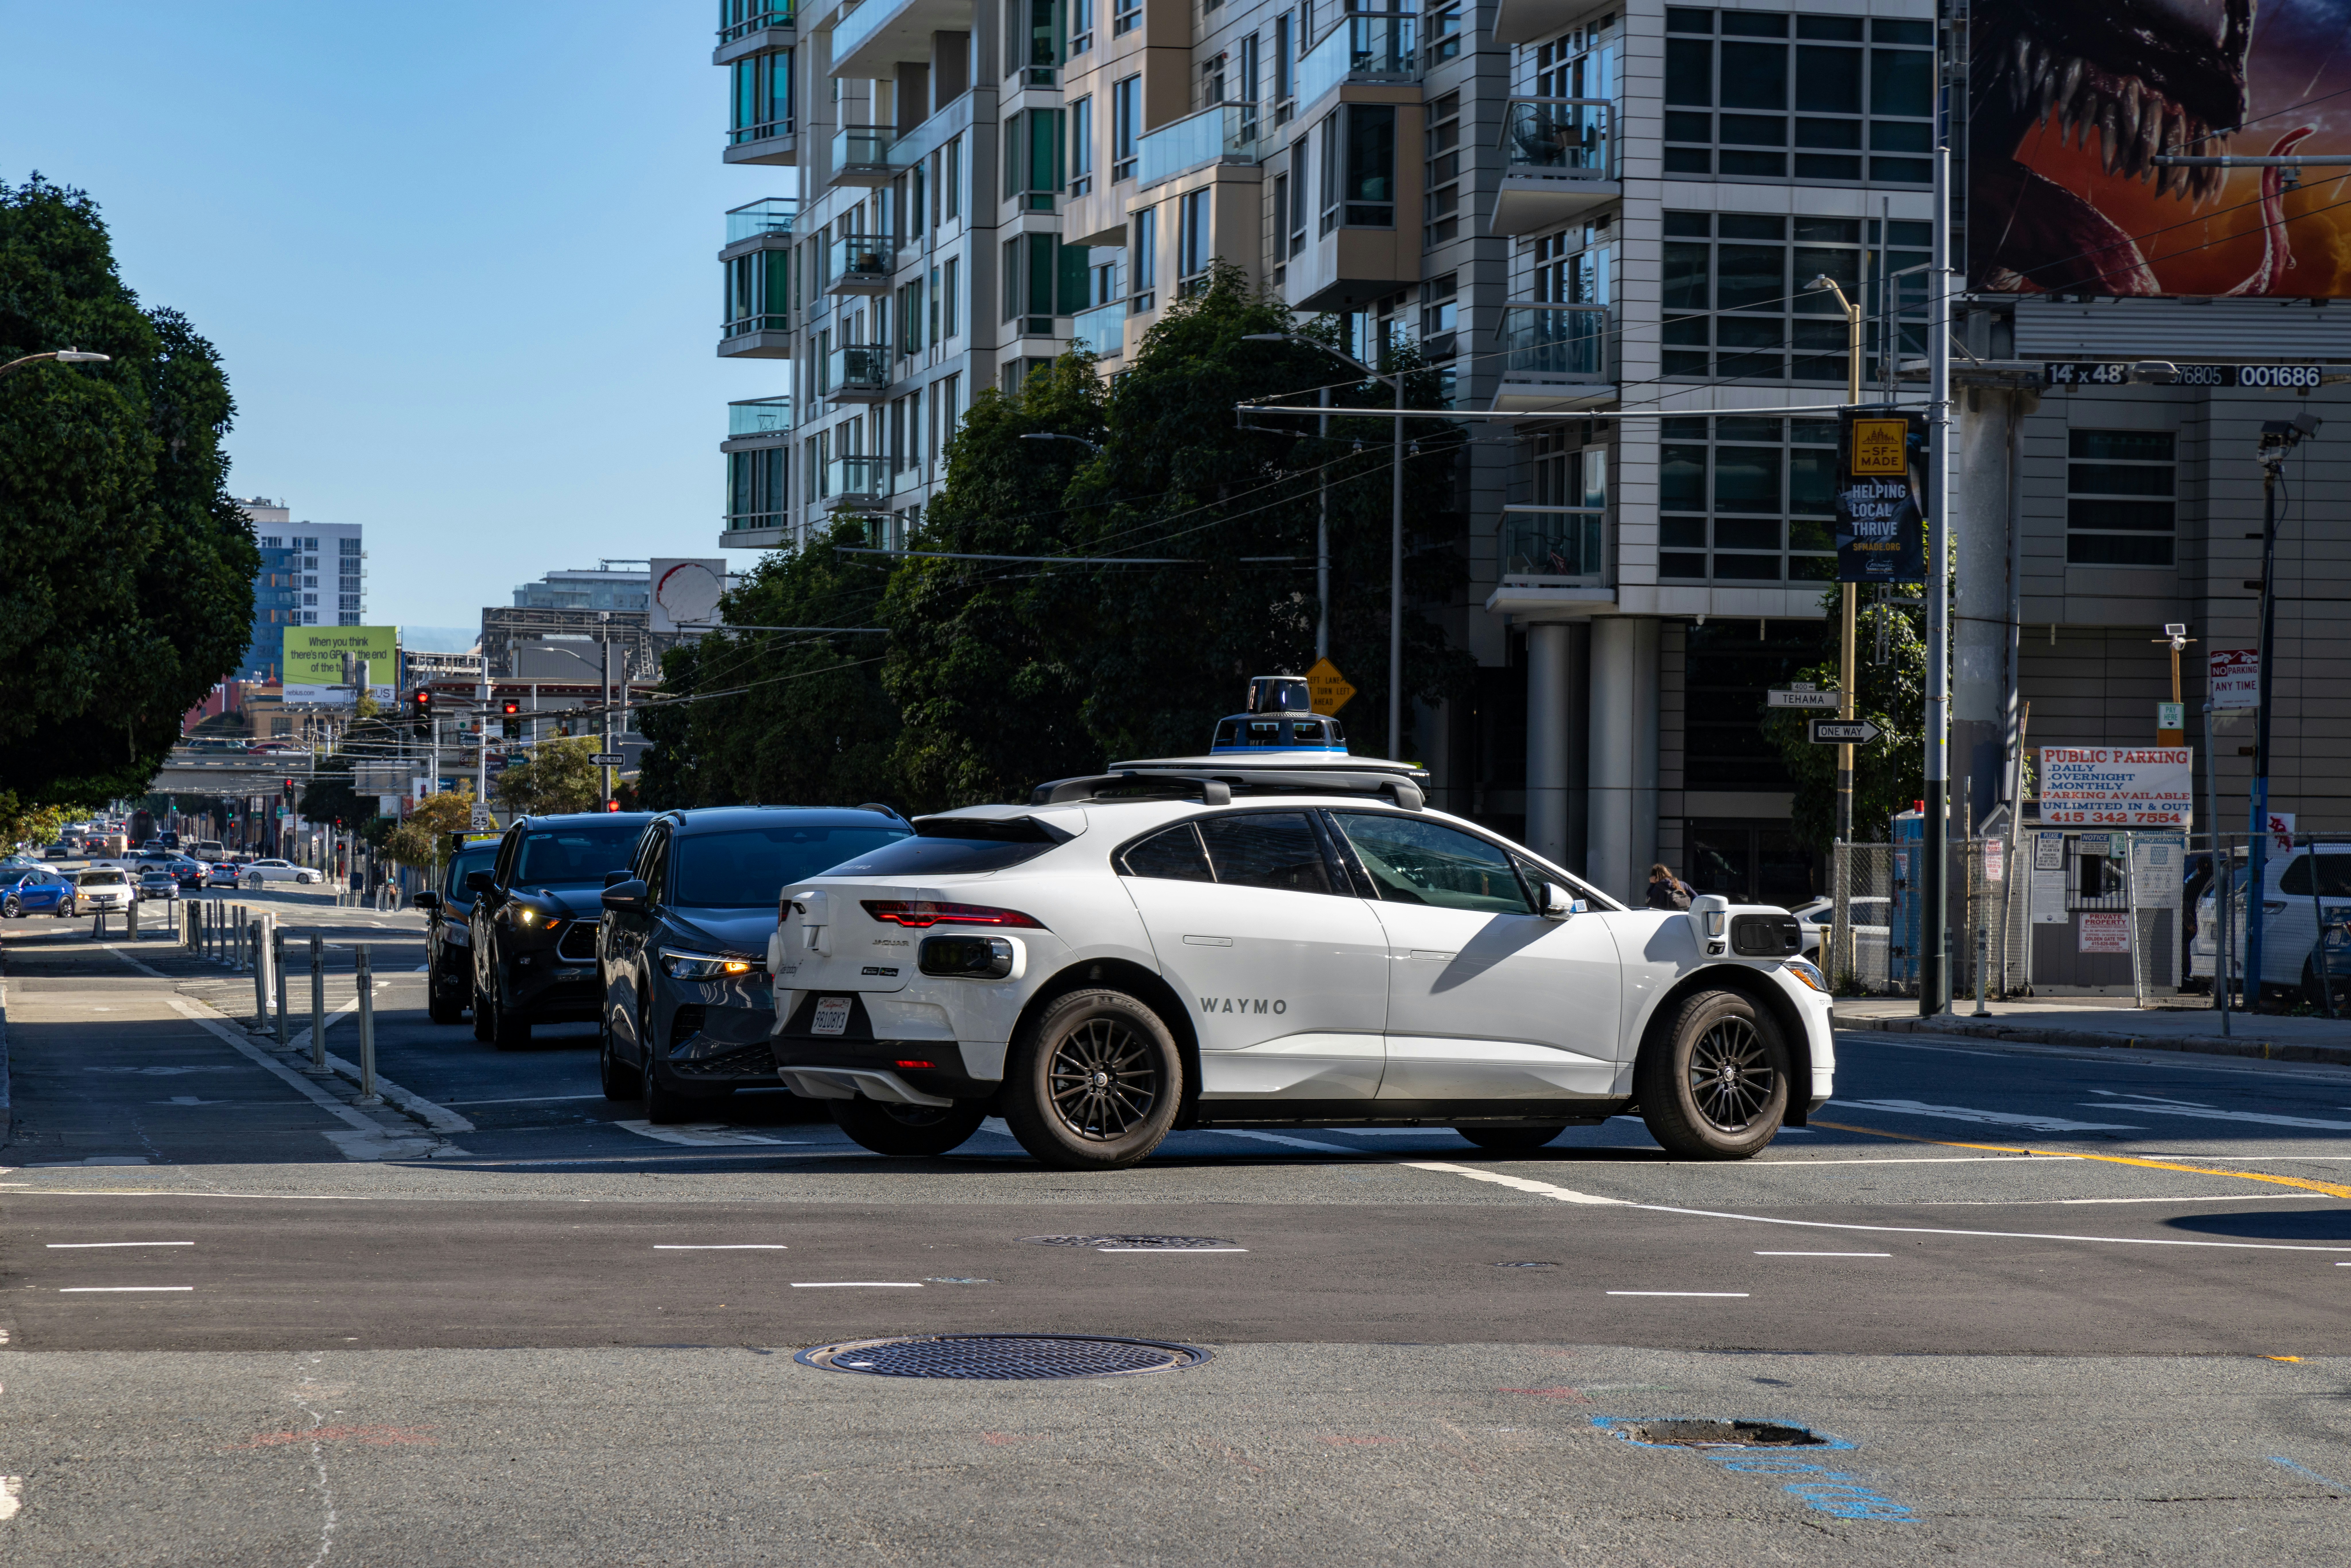
Waymo's robotaxis have logged over 50 million fully driverless miles. Photo: Unsplash
3. Incident Rates by Autonomy Level
One of the most important metrics in AV safety is the incident rate per million miles driven. This normalised figure allows meaningful comparison across different vehicle types, operators, and geographies. The data reveals a clear and consistent pattern: higher levels of automation correlate with lower incident rates.
Incident Rate by Autonomy Level (per million miles)
Source: NHTSA SGO, IIHS, Swiss Re Institute, 2026
The average human driver in the United States is involved in approximately 4.2 incidents per million miles, based on NHTSA crash data adjusted for under-reporting. Level 2 ADAS systems (like Tesla Autopilot) reduce this to approximately 2.1 incidents per million miles — a 50% improvement. Level 4 robotaxis from Waymo achieve just 0.22 incidents per million miles in 2026, representing a 19× safety improvement over the human baseline.
It is important to note that "incident" in NHTSA reporting includes any collision, regardless of fault or severity. A minor fender-bender caused by another driver rear-ending a stationary AV counts as an incident. When fault-adjusted data is used, AV safety figures improve further. Waymo's own analysis of its San Francisco operations found that its vehicles were at fault in only 0.06 incidents per million miles — 70× better than the human average.
The IIHS (Insurance Institute for Highway Safety) published a landmark study in March 2026 analysing 6.8 million miles of Waymo data against a matched human-driver cohort. The study found Waymo vehicles had 85% fewer injury-causing crashes and 78% fewer police-reported crashes than human drivers in comparable conditions. This represents the most rigorous independent validation of AV safety to date.
4. Leading AV Companies: Safety Comparison
The AV industry is dominated by a handful of major players, each with distinct safety records, operational domains, and reporting practices. Understanding the differences between these companies is essential for interpreting the aggregate statistics.
AV Safety Improvement Over Time (Incidents per Million Miles)
Source: NHTSA SGO Database, Company Disclosures, IIHS 2026
| Company | Miles Logged | Incidents/1M mi | Cities Active | Status |
|---|---|---|---|---|
| Waymo (Alphabet) | 50M+ driverless | 0.22 | 5 | Commercial |
| Cruise (GM) | 12M driverless | 0.41 | 3 | Resuming ops |
| Baidu Apollo | 80M+ total | 0.38 | 11 | Commercial |
| WeRide | 35M total | 0.52 | 7 | Commercial |
| Pony.ai | 28M total | 0.61 | 6 | Commercial |
| Zoox (Amazon) | 8M total | 0.44 | 2 | Pilot |
| Mobileye | 22M total | 0.33 | 4 | Pilot |
| Tesla FSD | 5B+ (L2) | 2.1* | Global | Level 2 only |
*Tesla FSD operates at SAE Level 2 — driver must remain attentive. Not directly comparable to Level 4 systems.
Waymo remains the global safety benchmark. Its 2026 incident rate of 0.22 per million miles represents a 88% improvement from its 2020 figure of 1.8. The company's Phoenix operations — its most mature market — have achieved zero serious injury crashes in over 20 million fully driverless miles, a record that no human driver cohort of comparable size could match.
Cruise faced a significant setback in October 2023 when one of its vehicles was involved in a serious pedestrian incident in San Francisco, leading to a suspension of its California driverless permit. By 2026, Cruise has resumed limited operations under enhanced safety protocols and a new leadership team, with its incident rate improving substantially from its 2023 peak.
Chinese operators Baidu Apollo, WeRide, and Pony.ai have collectively logged more miles than all Western operators combined, though their reporting frameworks differ from NHTSA requirements. Independent analysis by the China Academy of Transportation Sciences suggests their incident rates are broadly comparable to Western Level 4 operators, though direct comparison is complicated by different road conditions and traffic patterns.
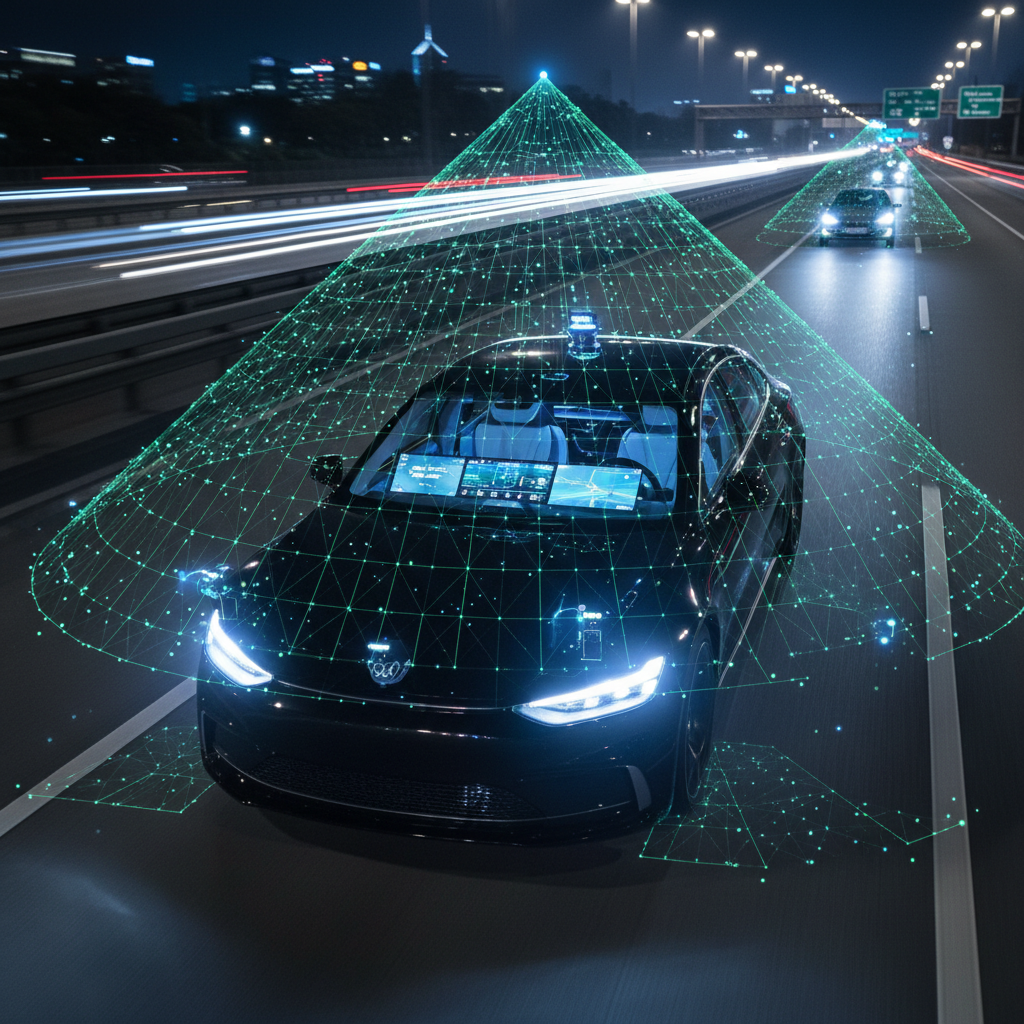
LiDAR, radar, and camera fusion are the sensory backbone of Level 4 autonomous vehicles. Photo: Unsplash
5. Root Causes of AV Accidents
Understanding why AV accidents occur is as important as knowing how often they occur. Analysis of NHTSA SGO reports, California DMV incident disclosures, and academic literature reveals a distinct pattern of causation that differs markedly from human-driver accidents.
Root Causes of AV Incidents (% of reported incidents, 2026)
Source: NHTSA SGO Database, California DMV AV Incident Reports, 2026
The most striking finding is that 38% of AV incidents are caused by the other vehicle — a human driver rear-ending, side-swiping, or failing to yield to the AV. This is a direct consequence of AVs behaving predictably and conservatively: they stop at yellow lights, maintain safe following distances, and do not run stop signs. Human drivers, accustomed to more aggressive behaviour, sometimes fail to anticipate these actions.
Sensor and perception failures account for 22% of incidents. These include LiDAR occlusion (objects hidden behind other objects), camera glare in low-sun conditions, radar interference in heavy rain, and edge cases where the perception system misclassifies objects. The most common scenario is an AV braking unexpectedly for a phantom object — a "ghost braking" event — which can cause rear-end collisions from following vehicles.
Software decision errors (18%) represent cases where the AV's planning and control algorithms made suboptimal decisions — merging too aggressively, misjudging a gap in traffic, or failing to handle an unusual road configuration. These are the incidents most amenable to improvement through software updates and expanded training data.
Infrastructure issues (12%) include faded lane markings, missing or damaged road signs, construction zones with temporary signage, and GPS/HD map inaccuracies. This category highlights the interdependence between AV safety and road infrastructure quality — a factor that disproportionately affects deployment in developing markets. For context on global road infrastructure disparities, see our Global Road Accidents Report.
6. Country-by-Country Deployment & Regulation
Advertisement
The global AV landscape is characterised by significant variation in deployment scale, regulatory frameworks, and safety outcomes. The following data represents the state of AV deployment as of mid-2026.
AV Deployment by Country (2026)
Source: NHTSA, MIIT China, European AV Alliance, national transport authorities, 2026
China leads in raw deployment numbers, with an estimated 3,200 AV vehicles in commercial or pilot operation across 48 permitted cities. The Chinese government's "Smart City" initiative has accelerated infrastructure investment, with dedicated AV lanes and V2X (vehicle-to-everything) communication infrastructure deployed in Wuhan, Shenzhen, and Beijing's Yizhuang district.
The United States has 1,840 permitted AV vehicles across 62 jurisdictions, but its regulatory framework is more fragmented — each state sets its own rules, creating a patchwork of requirements. The federal SELF DRIVE Act, passed in 2024, established minimum federal safety standards but preserved state authority over licensing and insurance requirements.
Germany enacted the world's first national Level 4 AV law (§1e StVG) in 2021 and has since expanded its framework to permit commercial operations in defined areas. As of 2026, 420 AV vehicles operate under German permits, primarily in Hamburg (autonomous buses), Munich (robotaxis), and Frankfurt (logistics vehicles).
Singapore stands out as a small-nation leader, with 180 AV vehicles operating commercially — an exceptionally high density for its population. The city-state's controlled environment, high-quality road infrastructure, and proactive regulatory approach have made it a global testbed. Nutonomy (now part of Motional) has operated driverless taxis in Singapore since 2022.
Japan passed its revised Road Traffic Act in 2023, permitting Level 4 operations on public roads. The country's AV deployment of 380 vehicles focuses heavily on rural mobility solutions — addressing the "last mile" problem in ageing communities where human drivers are scarce. This application of AV technology to social challenges is explored further in our Global Car Ownership Report 2026.
7. ADAS vs Full Autonomy: The Safety Spectrum
Advanced Driver Assistance Systems (ADAS) — the Level 1 and Level 2 technologies present in most new vehicles sold today — represent the largest-scale deployment of automated driving technology. Understanding their safety record is crucial for contextualising the broader AV safety picture.
Safety Performance by Autonomy Level (Incidents per Million Miles)
Source: NHTSA, IIHS, Euro NCAP, Swiss Re Institute, 2026
Automatic Emergency Braking (AEB), now mandatory on all new vehicles sold in the US (from September 2024) and EU (from July 2024), is estimated to prevent 28,000 crashes and 12,000 injuries annually in the United States alone, according to NHTSA projections. This single Level 1 feature represents one of the most impactful road safety interventions in decades.
Tesla's Full Self-Driving (FSD) system, operating at Level 2, presents a complex safety picture. Tesla's own data shows that vehicles using Autopilot or FSD have one accident per 5.7 million miles — compared to one per 670,000 miles for all vehicles in the US. However, critics note that Tesla's data is self-reported, that FSD is used disproportionately on highways (inherently safer), and that several high-profile fatal crashes have involved FSD engagement.
The Euro NCAP safety rating system incorporated ADAS performance into its scoring methodology in 2022, and by 2026, vehicles with comprehensive ADAS suites consistently score higher. The organisation's data shows that vehicles with Level 2 ADAS have 40–55% lower rates of serious injury crashes compared to vehicles with no automation, when controlling for vehicle age and driver demographics.
The transition from Level 2 to Level 3 introduces a critical safety challenge: the handover problem. Level 3 systems require the driver to take control when requested, but research from the MIT AgeLab and Stanford Human-Computer Interaction Group shows that drivers in Level 3 vehicles take an average of 3.8 seconds to resume manual control — a dangerous delay at highway speeds. This is why Honda's Traffic Jam Pilot (the first commercial Level 3 system) is limited to speeds below 30 km/h.
8. High-Profile AV Incidents: What We Learned
Several high-profile AV incidents have shaped public perception, regulatory responses, and industry safety practices. Examining these cases reveals important lessons about the current limitations of autonomous technology.
Uber ATG Fatal Crash — Tempe, Arizona (2018)
The first pedestrian fatality involving an autonomous vehicle. A Volvo XC90 operating in autonomous mode struck Elaine Herzberg, who was crossing outside a crosswalk. Investigation revealed the system had detected her but classified her as a "false positive" and suppressed the emergency braking response. Uber's safety driver was distracted. Outcome: Uber exited the AV business; NHTSA issued new AV safety guidance; industry-wide review of object classification systems.
Tesla Autopilot Fatal Crash — Mountain View, California (2018)
A Tesla Model X operating on Autopilot struck a concrete highway divider, killing the driver. Investigation found the driver's hands were not on the wheel for 6 seconds prior to impact. The Autopilot system failed to detect the divider due to faded lane markings. Outcome: NHTSA investigation; Tesla updated Autopilot to require more frequent driver engagement; ongoing debate about Level 2 "automation complacency."
Cruise Pedestrian Incident — San Francisco (2023)
A Cruise robotaxi struck a pedestrian who had already been hit by another vehicle, then dragged her approximately 20 feet before stopping. The AV's response to the initial collision — pulling over — was technically correct, but the system failed to detect the pedestrian under the vehicle. Outcome: California DMV suspended Cruise's driverless permit; GM halted all Cruise operations; $73.5M settlement; comprehensive safety review.
Waymo Intersection Incidents — San Francisco (2023–2024)
A series of incidents in which Waymo vehicles became confused at complex intersections, blocking traffic and in some cases making unexpected manoeuvres. No serious injuries resulted, but the incidents highlighted the challenge of "edge cases" — unusual traffic situations not well-represented in training data. Outcome: Waymo issued software updates; expanded its HD map coverage; incidents contributed to public debate about AV readiness.
These incidents, while serious, have driven significant safety improvements across the industry. The AV sector's response to failures — transparent reporting, rapid software updates, and regulatory engagement — contrasts with the historically opaque nature of human driver accident investigation. As the RAND Corporation noted in its 2025 AV safety report: "The AV industry's willingness to publicly disclose and analyse incidents is itself a safety asset that the traditional automotive industry lacks."
Level 4 robotaxis operate without a safety driver in defined geographic zones. Photo: Unsplash
9. Regulatory Landscape: Global AV Laws 2026
The regulatory environment for autonomous vehicles has matured significantly since 2020, with 62 countries now having some form of AV-specific legislation or regulatory framework. However, the depth and sophistication of these frameworks varies enormously.
| Country/Region | Key Legislation | Max Permitted Level | Liability Framework |
|---|---|---|---|
| United States | SELF DRIVE Act (2024) + State laws | Level 4 (state-dependent) | Manufacturer + operator |
| European Union | EU AV Regulation (2023) | Level 4 (type-approved) | Product liability directive |
| Germany | §1e StVG (2021, amended 2024) | Level 4 (defined areas) | Operator primary |
| United Kingdom | Automated Vehicles Act (2024) | Level 4 (authorised) | Insurer + manufacturer |
| China | Intelligent Connected Vehicle Regulations (2023) | Level 4 (pilot zones) | Operator primary |
| Japan | Road Traffic Act Amendment (2023) | Level 4 (specific roads) | Operator primary |
| Singapore | Road Traffic (AV) Rules (2022) | Level 4 (licensed zones) | Operator + insurer |
| Australia | NRSS AV Framework (2023) | Level 3–4 (state trials) | Under development |
The UK's Automated Vehicles Act 2024 is widely regarded as the most comprehensive AV legislation globally. It creates a clear legal framework that distinguishes between the "user-in-charge" (who is not liable for driving when the AV is in control) and the "authorised self-driving entity" (the company responsible for the AV's behaviour). This clarity on liability is seen as a model for other jurisdictions.
The EU's approach through type-approval regulation means that AVs must meet standardised safety requirements before they can be sold or operated commercially — similar to how conventional vehicles are regulated. This creates a higher barrier to entry but ensures consistent safety standards across all 27 member states.
A critical unresolved issue in most jurisdictions is cybersecurity. AVs are, fundamentally, networked computers on wheels. The potential for remote hacking, GPS spoofing, or adversarial attacks on perception systems represents a safety risk that traditional road safety frameworks are ill-equipped to address. The UN's WP.29 cybersecurity regulation (R155), which came into force in 2022, is the most significant international standard, but enforcement and compliance verification remain challenging.
The economic implications of AV adoption are significant for vehicle ownership costs. As robotaxi services expand, they may reduce the need for private car ownership in urban areas — a trend we track in our Global Car Ownership Report 2026. The shift to mobility-as-a-service could fundamentally alter the true cost of car ownership for millions of urban residents.
10. The Road Ahead: AV Safety Projections to 2030
Based on current trajectory data, industry investment patterns, and regulatory developments, the following projections represent a consensus view of AV safety outcomes through 2030.
~1.2 Trillion
AV Miles Logged by 2030
At current CAGR of 71%, global AV miles will reach approximately 1.2 trillion by 2030, providing an unprecedented safety dataset.
< 0.05/M mi
Projected Incident Rate (Waymo)
Continued software improvements and expanded training data are expected to push Waymo's incident rate below 0.05 per million miles by 2028–2030.
~11,000
Lives Saved Annually (US)
RAND Corporation projects that if AVs reach 10% of US vehicle miles by 2030, approximately 11,000 lives could be saved annually.
90+
Countries with AV Laws
The number of countries with AV-specific legislation is projected to exceed 90 by 2028, driven by EU harmonisation and developing-market adoption.
The most significant near-term safety development is the mandatory AEB rollout. With AEB now required on all new vehicles in the US and EU, and similar mandates in Japan, South Korea, and Australia, the global vehicle fleet will see a dramatic improvement in baseline safety over the next decade as older vehicles are replaced. The IIHS estimates this single technology will prevent 24,000 deaths and 1.5 million injuries in the US over the next decade.
The path to widespread Level 4 deployment faces several key challenges beyond pure safety performance. Public trust remains a significant barrier: a 2026 AAA survey found that 68% of Americans are "afraid" to ride in a fully self-driving vehicle, down from 78% in 2019 but still a majority. Building trust requires not just good safety data but effective communication of that data to the public.
Infrastructure investment is the other critical enabler. AVs perform best on well-marked roads with reliable HD maps. Extending AV operations beyond well-mapped urban cores requires either significant infrastructure investment or advances in AV technology that reduce dependence on pre-mapped environments. The latter — sometimes called "unsupervised autonomy" — is the holy grail of the industry and remains years away from commercial deployment.
The economic case for AVs is increasingly compelling. Trucking companies deploying Level 4 autonomous trucks on fixed highway routes report fuel savings of 8–12% (due to optimised driving behaviour), zero driver fatigue incidents, and operating cost reductions of 25–35% per mile. These economics will accelerate commercial deployment in logistics before passenger applications reach mass market. For context on how vehicle operating costs are evolving, see our EV vs Gas comparison and car cost calculator.
The ultimate promise of autonomous vehicles — a world with dramatically fewer road deaths — is supported by the data of 2026. The technology works. The question is no longer whether AVs can be safer than humans, but how quickly and how broadly that safety benefit can be realised. With 1.35 million people dying on roads every year, the urgency of that question could not be greater.
"If autonomous vehicles had been deployed at scale in 2010, the data suggests we could have prevented over 10 million road deaths globally by 2026. That is the scale of the opportunity — and the urgency — we are dealing with." — Prof. Alain Kornhauser, Princeton University, 2026
Citations & Data Sources
- NHTSA Standing General Order (SGO) AV Incident Database, 2021–2026. National Highway Traffic Safety Administration.
- Waymo Safety Report 2026. Waymo LLC, Alphabet Inc. waymo.com/safety
- IIHS Study: "Waymo's Driverless Vehicles: Safety Performance vs. Human Drivers." Insurance Institute for Highway Safety, March 2026.
- California DMV Autonomous Vehicle Collision Reports, 2019–2026. California Department of Motor Vehicles.
- RAND Corporation: "Autonomous Vehicle Safety: 2025 Update." RAND Corporation, 2025.
- McKinsey Global Institute: "The Autonomous Vehicle Value Chain." McKinsey & Company, 2026.
- MIIT China: "Intelligent Connected Vehicle Industry Development Report 2025." Ministry of Industry and Information Technology, China.
- Euro NCAP: "ADAS Performance in New Vehicle Assessment, 2026 Results." European New Car Assessment Programme.
- UK Department for Transport: "Automated Vehicles Act 2024 — Implementation Guidance." HM Government, 2024.
- SAE International: "Taxonomy and Definitions for Terms Related to Driving Automation Systems (J3016)." SAE International, 2021.
Related Reports & Tools
Advertisement
Global Road Accidents Report 2026
1.35M deaths annually — full data
Global EV Statistics 2026
24.8M EVs sold worldwide
Global Fuel Consumption 2026
100.8M barrels/day analysis
EV Total Cost of Ownership
Tesla vs Honda 5-year comparison
Global Car Ownership Report 2026
1.5B cars on the road
Car Cost Calculator
Calculate your true ownership cost
Advertisement