Advertisement
There is a number that should stop every automotive analyst, policymaker, and car buyer in their tracks: 32.3%. That is the share of global vehicle production that China now controls. In 2026, Chinese factories produced 31.6 million vehicles — more than Europe and North America combined, more than the next three largest producers put together, and enough to replace every car on the roads of the United Kingdom, France, and Germany simultaneously.
This is not a story that crept up on the industry. China has been the world's largest vehicle producer since 2009. But what has changed — dramatically, irreversibly — is the nature of what China builds. In 2019, Chinese factories were largely assembling combustion-engine vehicles for domestic consumption, with modest export ambitions. By 2026, China is the undisputed global leader in electric vehicle production, with 14.3 million EVs manufactured — representing 45.3% of all vehicles built in the country and roughly 47% of all EVs produced anywhere on Earth.
The implications ripple outward in every direction. For consumers in Europe, Australia, and Southeast Asia, Chinese-made cars are arriving at price points that established brands cannot match. For legacy automakers in Germany, Japan, and the United States, the competitive pressure is existential. For policymakers, the question of how to respond — through tariffs, industrial subsidies, or strategic partnerships — has become one of the defining economic debates of the decade.
This report draws on data from the International Organisation of Motor Vehicle Manufacturers (OICA), the China Association of Automobile Manufacturers (CAAM), S&P Global Mobility, BloombergNEF, and the International Energy Agency (IEA) to provide the most comprehensive picture of China's vehicle production market available. For the broader global context, see our Global Vehicle Production Statistics 2026 report, and for the EV dimension, our Global EV Statistics 2026 deep-dive.
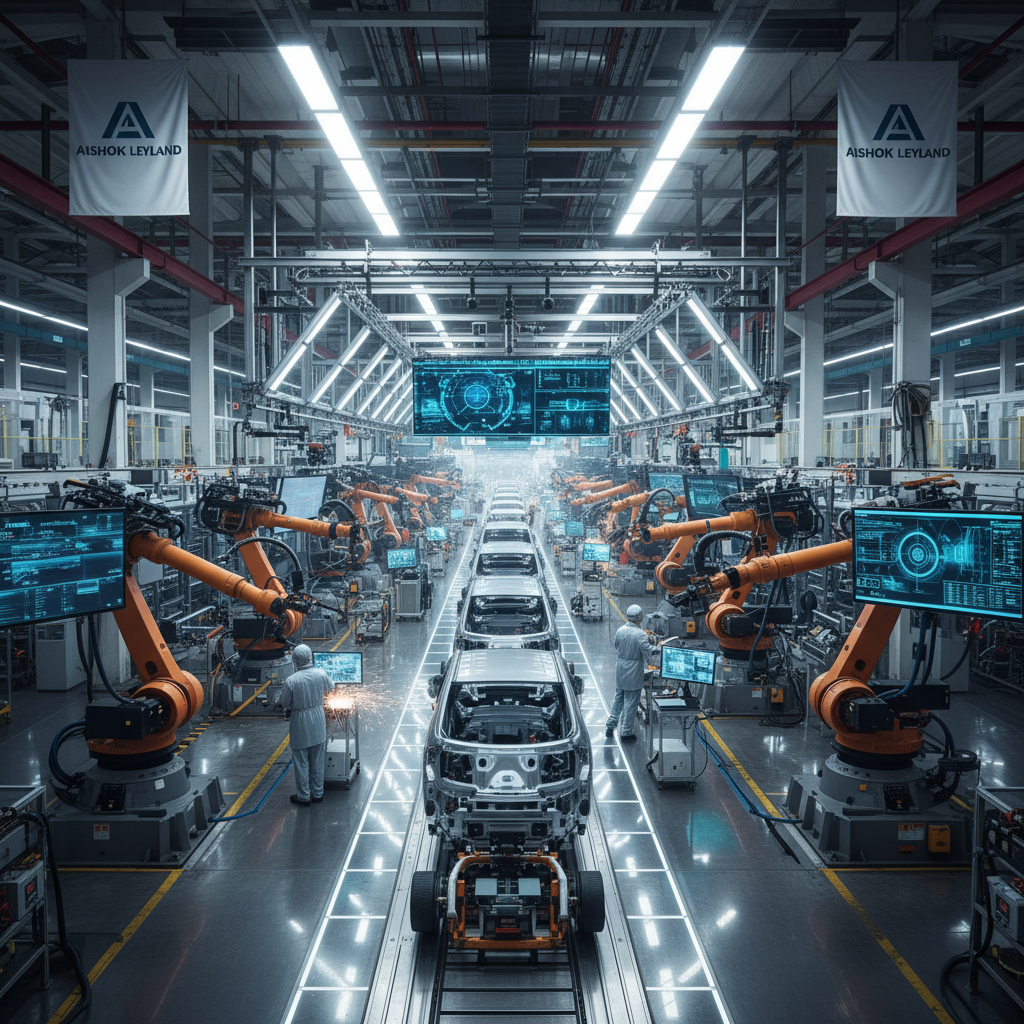
A modern Chinese automotive assembly facility. China produced 31.6 million vehicles in 2026 — 32.3% of global output. Photo: Unsplash
1. China's Automotive Dominance: The Numbers That Rewrite the Map
The scale of China's automotive output requires a moment of genuine reckoning. When the global automotive industry produced its first 10 million vehicles in a single year — a milestone reached in the early 1950s — the United States accounted for roughly 75% of that output. Today, China alone produces more than three times that historic milestone every twelve months.
The 31.6 million figure for 2026 represents a 0.6% increase over 2025's 31.4 million units — modest growth that reflects a maturing domestic market rather than any slowdown in China's industrial ambition. The real story is in the composition: the shift from ICE to EV production has been faster and more complete than any industry forecast predicted five years ago. In 2021, just 13.4% of Chinese-produced vehicles were electric. By 2026, that figure has reached 45.3%.
📊 Editorial Perspective: China's EV transition speed has no historical parallel in manufacturing. The country moved from 13% to 45% EV production share in just five years — a transformation that took the global solar panel industry nearly two decades to achieve. The automotive world has not fully absorbed what this means.
| Metric | 2024 | 2025 | 2026 |
|---|---|---|---|
| Total Production | 30.9M | 31.4M | 31.6M |
| EV Production | 11.2M | 12.8M | 14.3M |
| EV Share of Production | 36.2% | 40.8% | 45.3% |
| Total Exports | 4.9M | 5.1M | 5.4M |
| Global Production Share | 33.1% | 32.8% | 32.3% |
| Avg Production Cost/Unit | $17,800 | $18,100 | $18,400 |
| Number of EV Models Available | 312 | 389 | 447 |
Source: CAAM (China Association of Automobile Manufacturers); OICA 2026; S&P Global Mobility
One figure that often gets lost in the headline numbers: China's share of global production has actually declined slightly from its 2024 peak of 33.1% to 32.3% in 2026. This is not because China is slowing down — it is because India, Mexico, and several Southeast Asian nations are growing faster from a lower base. China's absolute output continues to rise; its relative dominance is simply being diluted at the margins by a broader industrialisation wave across the developing world.
2. A Decade of Production: From Workshop to World Factory
China's automotive ascent is one of the most compressed industrial transformations in economic history. In 2000, China produced fewer than 2 million vehicles per year — less than 3% of global output. By 2009, it had overtaken the United States to become the world's largest producer. By 2016, it was producing more than the entire European Union. By 2026, it produces more than Europe, North America, and Japan combined.
The trajectory has not been without turbulence. Production peaked at 28.1 million units in 2016 before declining for two consecutive years as the government removed purchase subsidies and the domestic market cooled. The COVID-19 pandemic caused a sharp drop to 25.2 million in 2020. But the recovery was faster and more decisive than anywhere else in the world, driven by aggressive government stimulus, the rapid rollout of EV incentives, and the emergence of genuinely competitive domestic brands.
China Vehicle Production 2010–2026 (Millions of Units)
Source: CAAM; OICA World Motor Vehicle Production Statistics
What the chart above does not fully capture is the qualitative shift that has occurred alongside the volume growth. In 2010, Chinese-produced vehicles were largely joint-venture products — Volkswagens, GMs, and Toyotas assembled in China under licence, with Chinese partners providing the factory floor and foreign partners providing the technology. By 2026, the most dynamic growth is coming from indigenous Chinese brands: BYD, NIO, Li Auto, Xpeng, and Huawei-backed Aito, which are developing their own platforms, software stacks, and battery technology without foreign partnership.
This shift has profound implications for the joint-venture model that has underpinned foreign automaker profits in China for three decades. Volkswagen's China joint ventures — once generating 40% of the group's global profits — saw combined sales fall 18% in 2025. General Motors' China operations reported their first annual loss since entering the market in 1997. The technology transfer that foreign automakers provided in exchange for market access has, in the view of many industry observers, been comprehensively absorbed and surpassed.
Advertisement
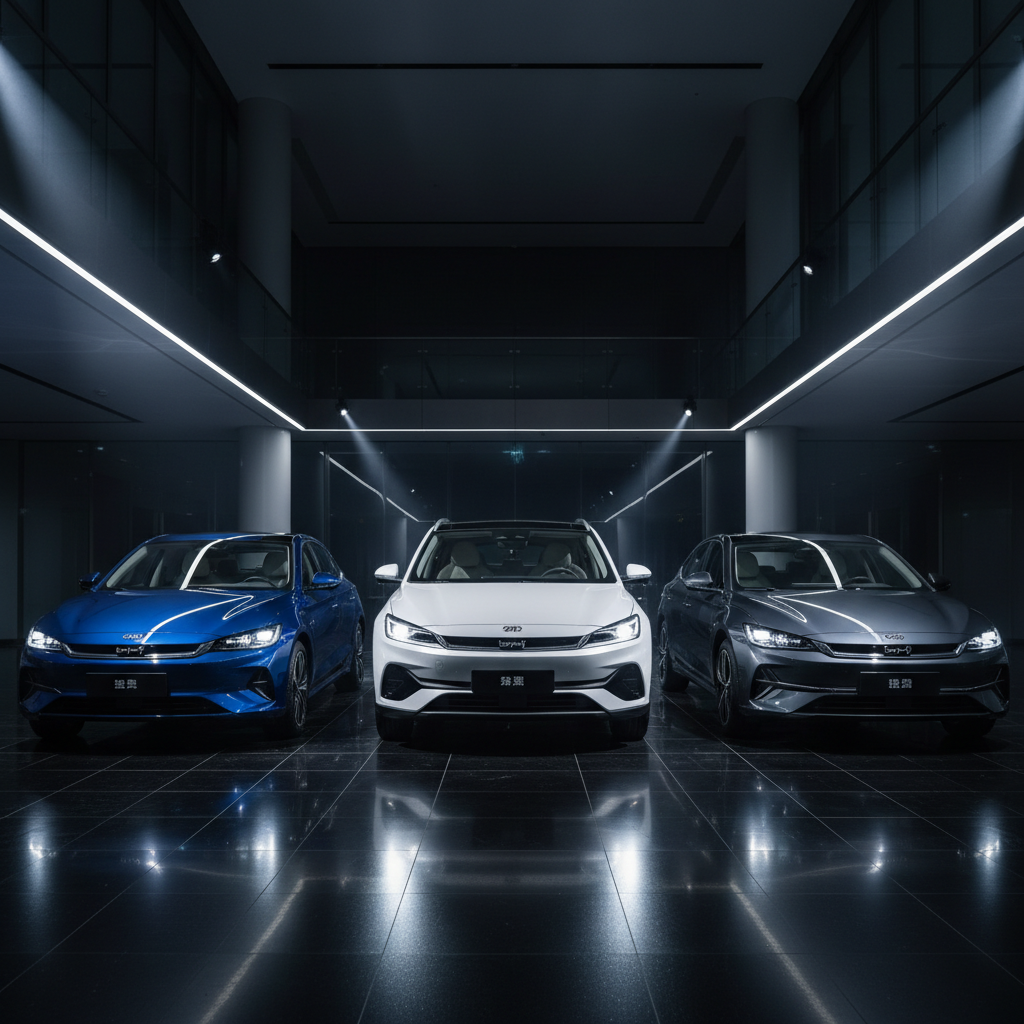
Chinese EV brands like BYD have moved from domestic challengers to global competitors in under a decade. Photo: Unsplash
3. The Chinese OEM Landscape: Who Builds What
China's automotive industry is not a monolith. It is a sprawling ecosystem of state-owned enterprises, private conglomerates, technology-company-backed startups, and foreign joint ventures — all competing fiercely in the world's largest and most dynamic car market. Understanding who builds what, and how fast they are growing, is essential to understanding where the global industry is heading.
Top Chinese Automakers by Production Volume 2026 (Millions of Units)
Source: CAAM; company annual reports; S&P Global Mobility 2026
SAIC Motor remains China's largest automaker by volume at 5.8 million units, but its position is under pressure. SAIC's strength has historically come from its joint ventures with Volkswagen and General Motors — partnerships that are now struggling as Chinese consumers shift to domestic EV brands. SAIC's own EV brand, IM Motors, and its MG brand (which it acquired from the UK's Rover Group in 2007) are growing, but not fast enough to offset the decline in joint-venture volumes.
BYD is the story of the decade. Founded in 1995 as a battery manufacturer, BYD produced just 450,000 vehicles in 2019. By 2026, it produces 4.2 million — a 9x increase in seven years. Every single one is electric or plug-in hybrid. BYD's vertical integration is extraordinary: it manufactures its own batteries, semiconductors, electric motors, and increasingly its own steel. This integration allows BYD to produce an entry-level EV — the Seagull — for approximately $9,700, a price point that no Western or Japanese automaker can approach.
The newer entrants — NIO, Li Auto, and Xpeng — represent a different model: technology-first companies that have built their vehicles around software, over-the-air updates, and premium user experience rather than manufacturing scale. NIO's battery-swap network (1,800+ stations across China) and its subscription-based battery model are innovations that have no equivalent in Western markets. Li Auto's extended-range electric vehicles, which use a small petrol generator to extend range, have proven particularly popular with Chinese consumers anxious about charging infrastructure in rural areas.
| Automaker | Units (M) | EV Share | Key Brands |
|---|---|---|---|
| SAIC Motor | 5.8M | 28% | Buick, VW (JV), MG, IM Motors |
| BYD | 4.2M | 100% | BYD, Denza, Yangwang, Fang Cheng Bao |
| FAW Group | 3.9M | 22% | Hongqi, Toyota (JV), Audi (JV) |
| Dongfeng Motor | 3.4M | 19% | Nissan (JV), Honda (JV), Voyah |
| Changan Auto | 2.8M | 31% | Changan, Deepal, Avatr |
| Geely Auto | 2.6M | 35% | Geely, Lynk & Co, Zeekr, Volvo |
| BAIC Group | 2.1M | 24% | BAIC, Mercedes (JV), ARCFOX |
| GAC Group | 1.9M | 27% | Trumpchi, Aion, Toyota (JV) |
| NIO | 0.6M | 100% | NIO, ONVO, Firefly |
| Li Auto | 0.5M | 100% | Li Auto (EREV) |
Source: CAAM; company annual reports 2026; S&P Global Mobility
4. The EV Revolution Inside China's Factories
No single data point better illustrates the pace of China's industrial transformation than its EV production trajectory. In 2019, China produced 1.2 million electric vehicles — a respectable figure, but one that represented less than 5% of its total output. By 2026, that number has reached 14.3 million EVs, representing 45.3% of all vehicles manufactured in the country. China now produces more EVs in a single month than the entire world produced in all of 2019.
China EV Production Growth 2019–2026
Source: CAAM; IEA Global EV Outlook 2026; BloombergNEF
The government's role in this transformation cannot be overstated — but it is also frequently mischaracterised. Western commentary often reduces China's EV success to subsidies and state direction. The reality is more nuanced. Yes, China spent an estimated $57 billion on EV purchase subsidies between 2009 and 2022. But those subsidies have largely been phased out. The competitive advantage that Chinese EV makers now hold is not primarily subsidy-driven — it is the result of a decade of genuine technological investment, supply chain development, and the creation of the world's most sophisticated battery manufacturing ecosystem.
China controls approximately 75% of global lithium-ion battery cell manufacturing capacity, according to BloombergNEF. It processes roughly 60% of the world's lithium, 85% of its cobalt, and 70% of its graphite — the key materials in EV batteries. This is not accidental. China identified battery technology as a strategic priority in its "Made in China 2025" industrial policy, and has invested accordingly. The result is a cost advantage that compounds at every stage of the EV supply chain.
For consumers, the practical consequence is a range of EVs at price points that simply do not exist outside China. The BYD Seagull starts at approximately $9,700. The BYD Dolphin — a genuinely competitive compact EV — starts at $13,500. The BYD Atto 3, which is sold in Europe and Australia, starts at $38,000 in those markets but costs roughly $22,000 to produce. For more on how these production economics translate to consumer prices, see our Global Vehicle Production Cost Breakdown.
Advertisement

China produced 14.3 million electric vehicles in 2026 — 45.3% of all vehicles manufactured in the country. Photo: Unsplash
5. Production Costs: Why China Builds Cars for Less
The average cost to produce a vehicle in China in 2026 is approximately $18,400 — roughly 37% less than in Germany ($34,200), 38% less than in the United States ($29,800), and 29% less than in Japan ($26,100). This cost gap is the central fact of the global automotive competitive landscape, and understanding its components is essential to assessing whether it is structural or temporary.
Average Vehicle Production Cost by Country 2026 (USD)
Source: S&P Global Mobility; KPMG Automotive Industry Report 2026; OICA
Labour costs are the most visible component of China's advantage, but they are no longer the most important. Average automotive assembly wages in China have risen to approximately $12–15 per hour — still well below Germany's $52/hr or the US's $32/hr, but no longer the dramatic gap of a decade ago. The more durable advantages lie elsewhere:
Battery Supply Chain
CATL, BYD, and CALB supply batteries at $68–75/kWh — roughly 20% cheaper than equivalent cells sourced outside China, due to scale and raw material access.
Supplier Ecosystem
China has developed the world's most complete automotive supplier ecosystem. A Chinese OEM can source 90%+ of components domestically, eliminating import costs and logistics complexity.
Factory Automation
Chinese EV factories are among the most automated in the world. BYD's Shenzhen plant operates with a robot-to-worker ratio of 1:1.2 — comparable to Tesla's Gigafactories.
Land & Energy
Industrial land costs and energy prices in China's manufacturing heartland remain significantly below Western equivalents, despite rising in recent years.
The critical question is whether this cost advantage is sustainable as Chinese wages rise and as other countries develop their own EV supply chains. Our assessment: the labour cost gap will narrow, but the battery supply chain advantage is likely to persist for at least a decade. Building the equivalent of China's battery manufacturing ecosystem — from lithium processing to cell manufacturing to pack assembly — requires not just capital but time, expertise, and the kind of industrial policy consistency that Western democracies have historically struggled to maintain across electoral cycles.
6. China's Export Machine: 5.4 Million Cars Shipped Abroad
In 2020, China exported 1.1 million vehicles. In 2026, it exported 5.4 million — a near-fivefold increase in six years. China is now the world's largest vehicle exporter, having overtaken Japan in 2023 and Germany in 2022. This is perhaps the single most consequential development in the global automotive industry since the Japanese invasion of Western markets in the 1970s and 1980s.
China Vehicle Export Destinations 2026 (5.4M Total)
Source: CAAM; China Customs; S&P Global Mobility 2026
Europe is the largest destination for Chinese vehicle exports, receiving 1.62 million units (30% of total exports) in 2026. This figure includes both Chinese-brand vehicles (BYD, MG, Nio, Xpeng) and vehicles produced in China by Western brands for export (Tesla Model 3 and Y from Shanghai, BMW iX3, Volvo XC40). The distinction matters: approximately 40% of "Chinese exports" to Europe are actually vehicles from Western or joint-venture brands manufactured in China.
Southeast Asia has become the second-largest destination (1.08 million units, 20%), with Thailand, Indonesia, and Vietnam emerging as key markets. Chinese brands have moved aggressively into these markets, often undercutting Japanese competitors — who have dominated Southeast Asian automotive markets for decades — by 15–25% on comparable models. Toyota, Honda, and Mitsubishi have all reported market share losses in the region.
The Middle East (0.81 million units, 15%) has proven particularly receptive to Chinese EVs, with Saudi Arabia, UAE, and Israel all seeing rapid adoption. The region's combination of high incomes, low electricity costs, and government-driven sustainability targets creates ideal conditions for EV penetration. BYD has signed distribution agreements with major dealers in all three Gulf Cooperation Council states.
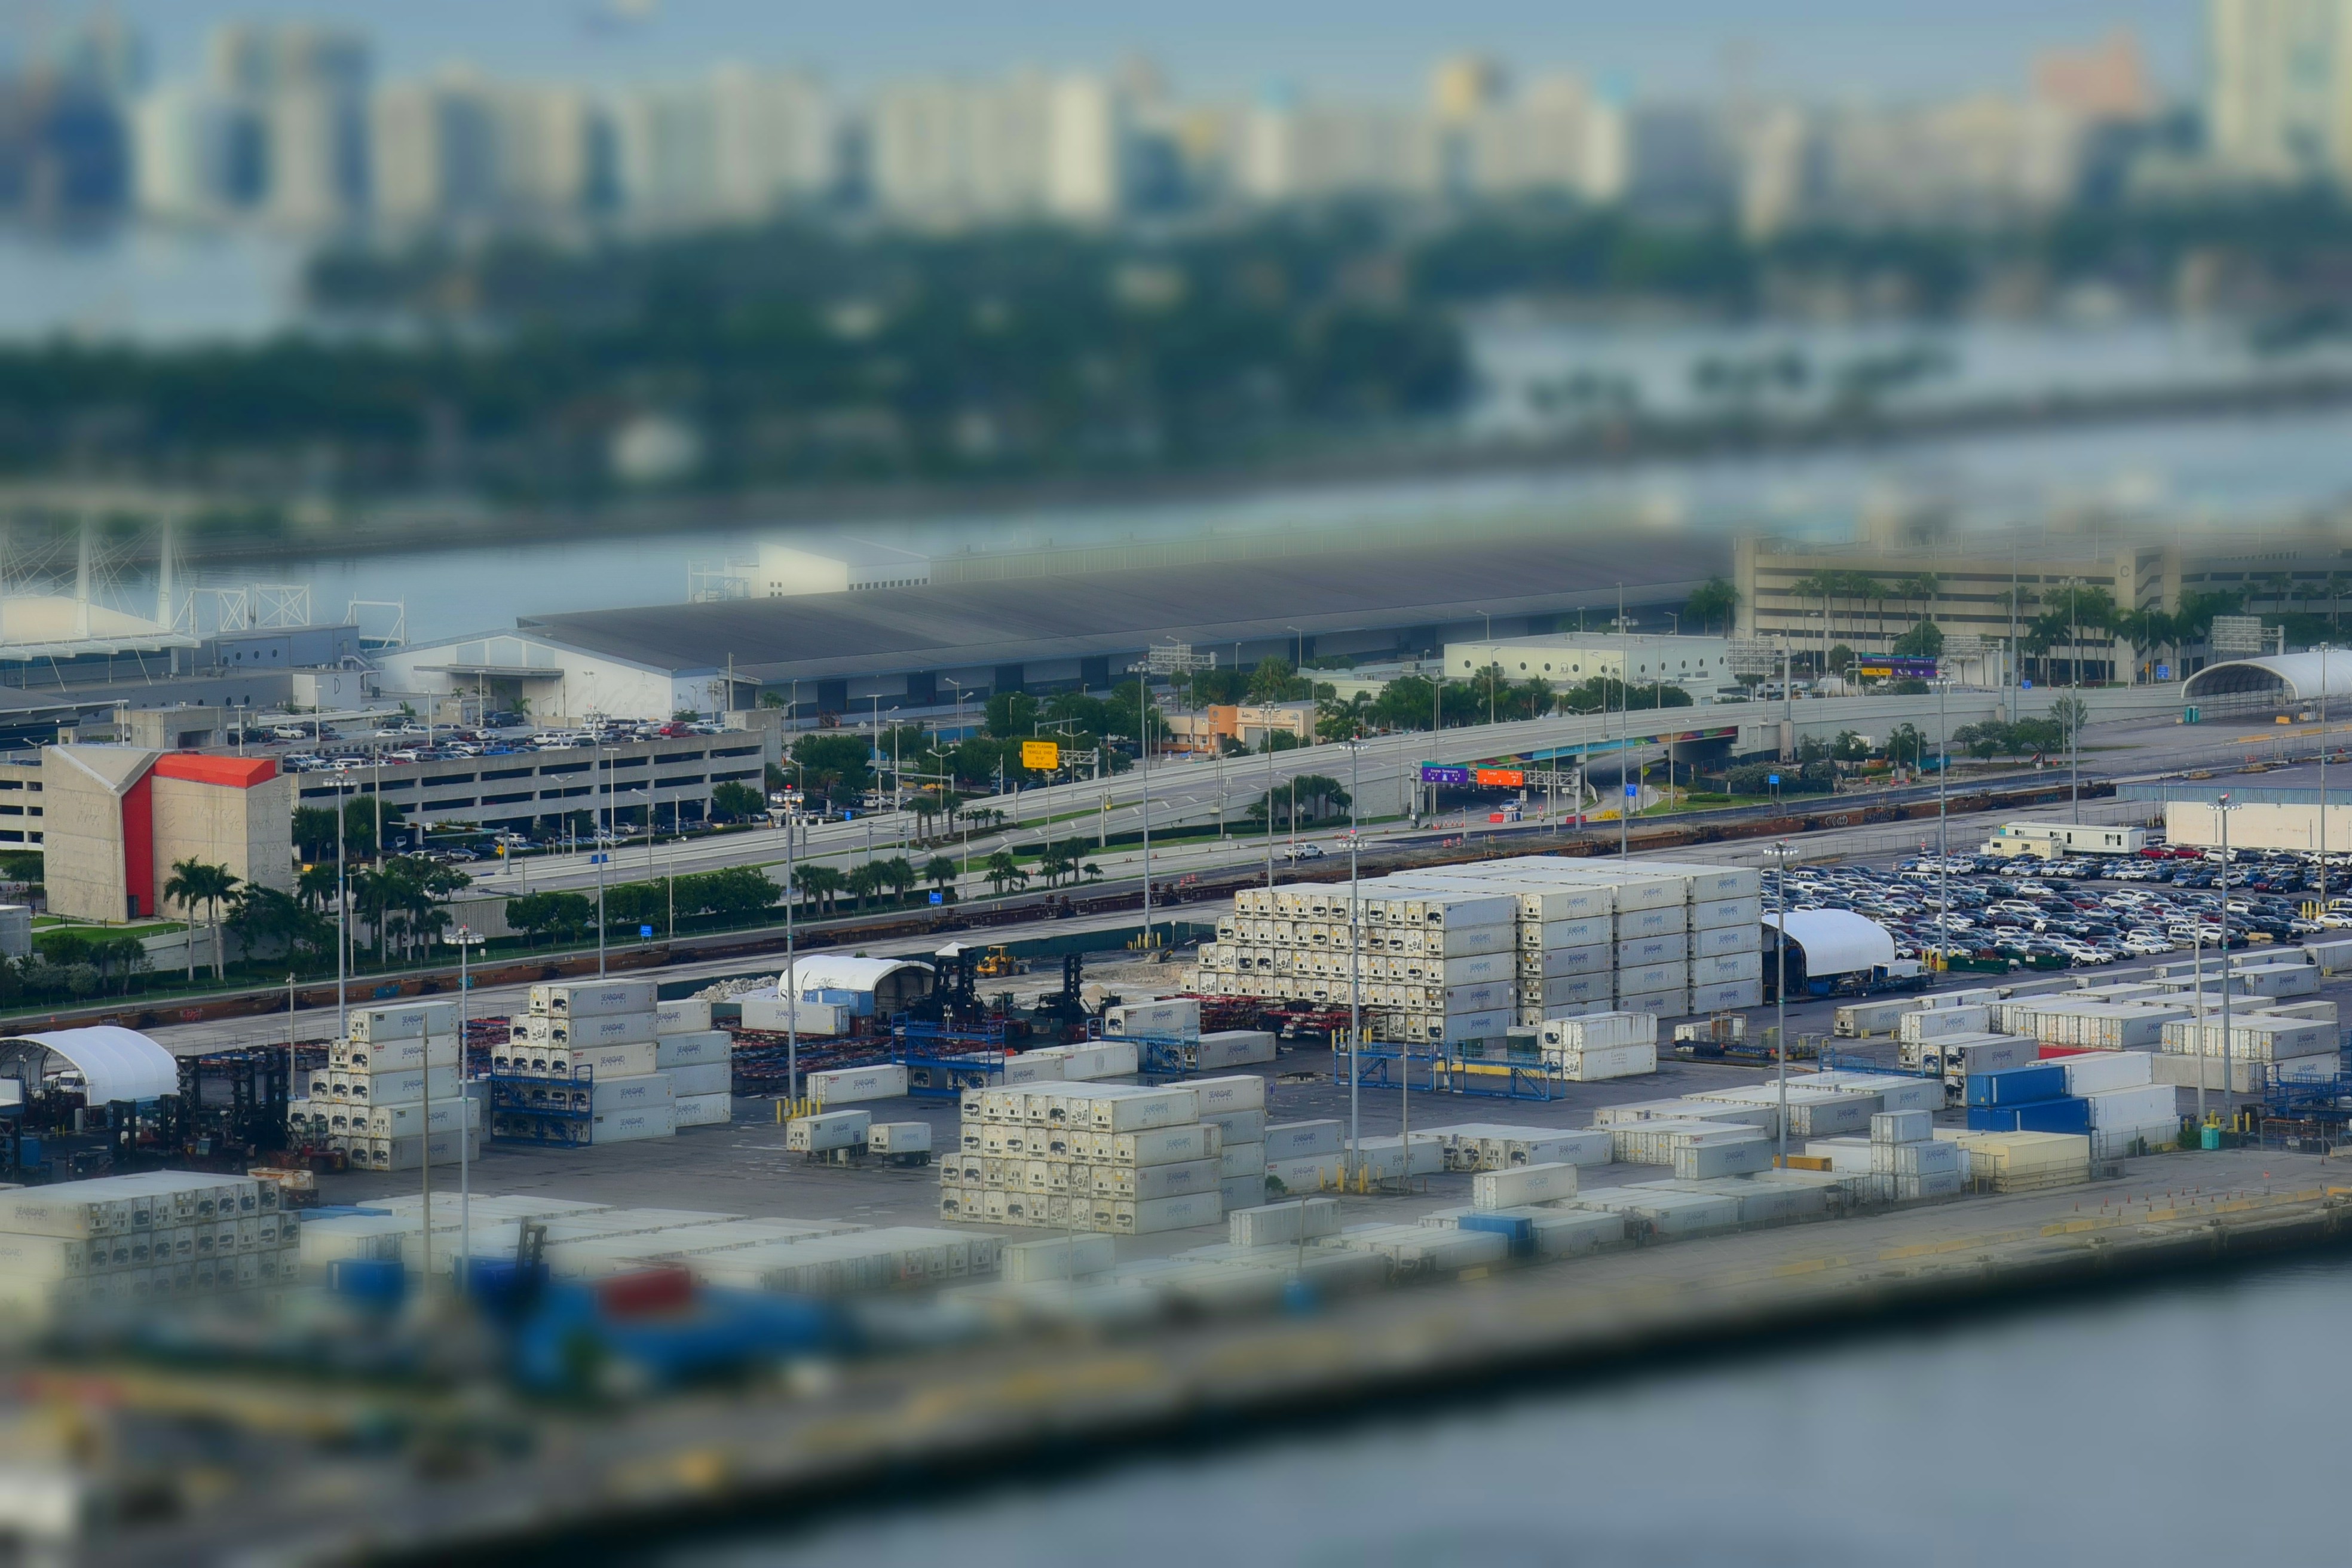
China exported 5.4 million vehicles in 2026, making it the world's largest vehicle exporter for the fourth consecutive year. Photo: Unsplash
7. The Geopolitics of Chinese Auto Exports
The rise of Chinese vehicle exports has triggered one of the most significant trade policy responses in the automotive industry's history. In October 2024, the European Union imposed additional tariffs of up to 35.3% on Chinese-made EVs, on top of the existing 10% import duty. The United States had already raised tariffs on Chinese EVs to 100% in May 2024. Canada followed with 100% tariffs in August 2024. These measures represent a fundamental reassessment of the free-trade consensus that governed automotive trade for three decades.
The tariff response has had mixed results. In the United States, the 100% tariff has effectively blocked Chinese-brand vehicles from the market — but it has not prevented Chinese battery technology from entering through partnerships with US automakers. Ford's BlueOval battery plant in Michigan uses CATL technology under licence. GM has a battery technology partnership with POSCO, which itself sources materials from Chinese suppliers. The supply chain is too deeply integrated to be severed by border tariffs alone.
In Europe, the picture is more complex. The EU tariffs have slowed the growth of Chinese brand exports but have not reversed them. BYD, which had planned to export 300,000 vehicles to Europe in 2026, revised its target to 180,000 — still a significant presence. More importantly, Chinese automakers are responding by building factories inside the EU: BYD has a plant under construction in Hungary, SAIC is expanding its UK operations, and Chery has announced a joint venture in Spain. Tariffs on imports do not apply to locally manufactured vehicles, so the Chinese response to European protectionism is to become European manufacturers.
🌍 Editorial View: The tariff response to Chinese automotive exports is understandable as short-term industrial policy, but it is unlikely to be sufficient as a long-term strategy. Chinese automakers are not standing still — they are localising production, building brand recognition, and continuing to invest in technology. The question for Western governments is not whether to protect their automotive industries, but whether protection alone can substitute for the industrial investment needed to compete.
For consumers in markets where Chinese vehicles are available without prohibitive tariffs — Australia, Southeast Asia, the Middle East, Latin America — the competitive pressure is already translating into lower prices and better value. Australian consumers can now buy a BYD Atto 3 for A$44,990 — roughly equivalent to a Toyota RAV4 Hybrid, but with more technology, a longer warranty, and lower running costs. For a full cost comparison, see our Australia Car Cost Data.
Advertisement
8. What Western Automakers Are Getting Wrong
There is a tendency in Western automotive commentary to frame China's rise as primarily a story of unfair competition — subsidies, currency manipulation, forced technology transfer, and state direction. These factors are real and have played a role. But they do not fully explain why Chinese EVs are winning in markets where they compete on a level playing field, and they do not explain why Western automakers have been slow to respond even when the threat was clearly visible.
The more uncomfortable truth is that Western automakers made a series of strategic errors that Chinese competitors did not. They underinvested in battery technology, assuming that their ICE expertise would translate to EVs. They maintained complex, expensive manufacturing processes designed for combustion engines rather than building EV-native platforms from scratch. They prioritised short-term profitability over long-term market position, continuing to sell high-margin ICE vehicles in China even as the market was shifting beneath them.
Volkswagen's experience is instructive. The company entered the Chinese market in 1984 and built it into its most profitable region. For three decades, the Volkswagen Passat and Jetta were the aspirational vehicles of China's rising middle class. But Volkswagen was slow to develop competitive EVs for the Chinese market, and when it did — the ID.4 and ID.6 — they were criticised by Chinese consumers for inferior software, slower over-the-air updates, and less intuitive interfaces compared to domestic competitors. In a market where the in-car technology experience has become as important as the driving experience, Volkswagen's mechanical excellence was insufficient.
The lesson that some Western automakers are beginning to absorb: competing with China in EVs requires not just matching the hardware, but matching the software, the user experience, and the speed of iteration. Tesla understood this early, which is why its Shanghai Gigafactory — producing 750,000 vehicles per year — remains competitive in China despite intense local competition. For context on how these competitive dynamics affect vehicle costs globally, see our Global Vehicle Production Cost Breakdown and our Best Cars to Buy in 2026 guide.
9. The Road Ahead: China's Production Forecast to 2030
Forecasting China's automotive production is an exercise in navigating genuine uncertainty. The domestic market is maturing — annual growth rates of 15–20% are a memory — but the export opportunity is expanding rapidly. The key variables are: the pace of EV adoption in key export markets, the effectiveness of tariff barriers, the trajectory of Chinese domestic demand, and the competitive response of Western and Japanese automakers.
| Year | Total Production | EV Production | EV Share | Exports |
|---|---|---|---|---|
| 2026 (actual) | 31.6M | 14.3M | 45.3% | 5.4M |
| 2027 (forecast) | 32.1M | 16.2M | 50.5% | 5.9M |
| 2028 (forecast) | 32.8M | 18.4M | 56.1% | 6.4M |
| 2029 (forecast) | 33.4M | 20.5M | 61.4% | 6.9M |
| 2030 (forecast) | 34.2M | 23.1M | 67.5% | 7.5M |
Source: S&P Global Mobility China Forecast 2026; BloombergNEF; CAAM projections
The consensus forecast from S&P Global Mobility, BloombergNEF, and CAAM projects China's total production reaching 34.2 million vehicles by 2030, with EVs accounting for 67.5% of output. If these projections prove accurate, China will be producing more EVs in 2030 than the entire world produces today. The export figure of 7.5 million would make China responsible for roughly 1 in 14 vehicles sold globally outside its borders.
The wildcard in these forecasts is the geopolitical environment. A significant escalation in US-China trade tensions — particularly if it extends to semiconductor export controls that affect automotive chips — could disrupt Chinese production. Conversely, a resolution of EU-China trade disputes that allows Chinese automakers to establish European manufacturing at scale could accelerate export growth beyond current forecasts.
What seems certain is that China's role in the global automotive industry will continue to grow in absolute terms, even if its relative share stabilises or declines slightly as India and Southeast Asia develop their own manufacturing bases. The question is not whether China will remain the world's dominant vehicle producer — it will — but whether it will also become the dominant force in the markets where its vehicles are sold.
By 2030, China is forecast to produce 23.1 million EVs annually — more than the entire world produces today. Photo: Unsplash
10. What This Means for Car Buyers Globally
For the vast majority of car buyers around the world, China's automotive dominance is not an abstract geopolitical concern — it is a practical reality that is already affecting the cars available to them, the prices they pay, and the technology they experience. The effects vary significantly by market.
Australia, Southeast Asia & Middle East
Direct competition from Chinese brands is already driving prices down and technology standards up. Buyers in these markets have access to Chinese EVs at prices 20–35% below equivalent Western models. The competitive pressure is forcing Japanese and Korean brands to accelerate their own EV programmes and improve value propositions.
Europe
EU tariffs have slowed but not stopped Chinese brand penetration. MG (owned by SAIC) is already the best-selling Chinese brand in Europe with 180,000+ annual sales. BYD, NIO, and Xpeng are building brand awareness. The tariff situation creates uncertainty, but Chinese automakers' plans to build European factories suggest a long-term commitment to the market.
United States & Canada
100% tariffs have effectively blocked Chinese-brand vehicles, but Chinese technology is present through battery partnerships and component supply. US consumers are not currently benefiting from Chinese price competition, which partly explains why the average new car price in the US ($49,758) remains significantly higher than in markets with Chinese competition.
Emerging Markets (Africa, Latin America)
Chinese brands are rapidly gaining market share in markets where Western brands have historically been too expensive for most buyers. In several African countries, Chinese vehicles now account for 30–40% of new car sales. This is creating first-time car ownership opportunities for millions of consumers who could not previously afford a new vehicle.
The broader implication for global car costs is significant. In markets where Chinese competition is allowed to operate freely, it is acting as a powerful deflationary force on vehicle prices — particularly in the EV segment. This is good news for consumers and for the pace of the EV transition, but it creates genuine challenges for the automotive industries of countries that have built their economic models around high-value vehicle manufacturing.
For buyers considering a Chinese-brand vehicle, the key questions are warranty support, parts availability, and resale value — areas where Chinese brands are still building their track records in Western markets. For a comprehensive guide to evaluating total cost of ownership across brands and powertrains, see our True Cost of Car Ownership guide and our Global Vehicle Depreciation Statistics 2026 report.
China vs Rest of World: Global Production Share 2010–2026 (%)
Source: OICA World Motor Vehicle Production Statistics; CAAM
Conclusion: The Factory That Runs the World
China's position as the world's dominant vehicle producer is not a temporary anomaly or the product of unfair advantages alone. It is the result of sustained, strategic investment in manufacturing capability, supply chain development, and technological innovation over more than two decades. The country has built the world's most complete automotive ecosystem — from raw material processing to battery manufacturing to vehicle assembly to software development — and it is now deploying that ecosystem to compete in global markets.
The 31.6 million vehicles produced in China in 2026 are not just a production statistic. They represent a fundamental shift in where automotive value is created, who controls the technology that powers the next generation of vehicles, and what consumers around the world can expect to pay for personal transportation. The Chinese automotive machine is not slowing down — it is accelerating, electrifying, and internationalising simultaneously.
For the global automotive industry, the question is no longer whether China will reshape the competitive landscape. It already has. The question is how quickly the rest of the world will adapt — and whether the adaptation will come through competition, collaboration, or the kind of managed trade that has historically produced suboptimal outcomes for everyone except the industries being protected.
For car buyers, the message is simpler: the Chinese automotive revolution is coming to your market, if it has not arrived already. Understanding what it means — for prices, for technology, for the brands you trust — is the first step to making better decisions. Use our Car Cost Calculator to compare total ownership costs across brands and powertrains, and our Global Car Costs tool to see how prices compare in your country.
Sources & Citations
- 1. OICA (Organisation Internationale des Constructeurs d'Automobiles). World Motor Vehicle Production Statistics 2026. Paris: OICA, 2026.
- 2. CAAM (China Association of Automobile Manufacturers). China Automotive Industry Statistical Yearbook 2026. Beijing: CAAM, 2026.
- 3. S&P Global Mobility. Global Light Vehicle Production Forecast Q3 2026. New York: S&P Global, 2026.
- 4. International Energy Agency. Global EV Outlook 2026. Paris: IEA, 2026. Available at: iea.org/reports/global-ev-outlook-2026
- 5. BloombergNEF. Electric Vehicle Outlook 2026. New York: Bloomberg Finance LP, 2026.
- 6. KPMG. Global Automotive Executive Survey 2026. Amsterdam: KPMG International, 2026.
- 7. European Commission. Anti-Subsidy Investigation on Electric Vehicles from China — Final Determination. Brussels: EC, October 2024.
- 8. McKinsey & Company. The Future of Mobility: China's Automotive Transformation. McKinsey Center for Future Mobility, 2026.
- 9. China Customs General Administration. China Automotive Export Statistics 2026. Beijing: GACC, 2026.
- 10. Benchmark Mineral Intelligence. Lithium-Ion Battery Supply Chain Report 2026. London: Benchmark, 2026.
Advertisement
Related Global Data Reports
Global Vehicle Production Statistics 2026
97.8 million vehicles worldwide. Full country data, charts, and 2030 forecasts.
Global DataGlobal EV Statistics 2026
24.8 million EVs sold. 22.4% global market share. The definitive EV report.
Global DataGlobal Vehicle Production Cost Breakdown
$28,900 average production cost. How factory economics shape the price you pay.
Global DataGlobal Vehicle Depreciation Statistics 2026
The average car loses 48% of its value in 5 years. Full country and brand data.