Advertisement
What Is Vehicle Depreciation?
Vehicle depreciation is the reduction in a car's market value over time. It is the single largest cost of car ownership — exceeding fuel, insurance, and maintenance combined for most drivers in the first five years. Unlike a house, which can appreciate, a car is a depreciating asset from the moment it leaves the dealership.
Depreciation is calculated as the difference between a vehicle's purchase price and its resale value at a given point in time. It is expressed either as a dollar amount or a percentage of the original price. The Kelley Blue Book, Black Book, CAP HPI (UK), and Schwacke (Germany) are the primary data sources used by dealers, insurers, and lenders to track residual values globally.
In 2026, with the global average new car price reaching $35,800 (up from $28,400 in 2019), the absolute dollar value of depreciation has never been higher. A typical buyer purchasing a $35,800 vehicle today will lose approximately $17,200 in value by year five — more than the total cost of a budget car in many emerging markets.
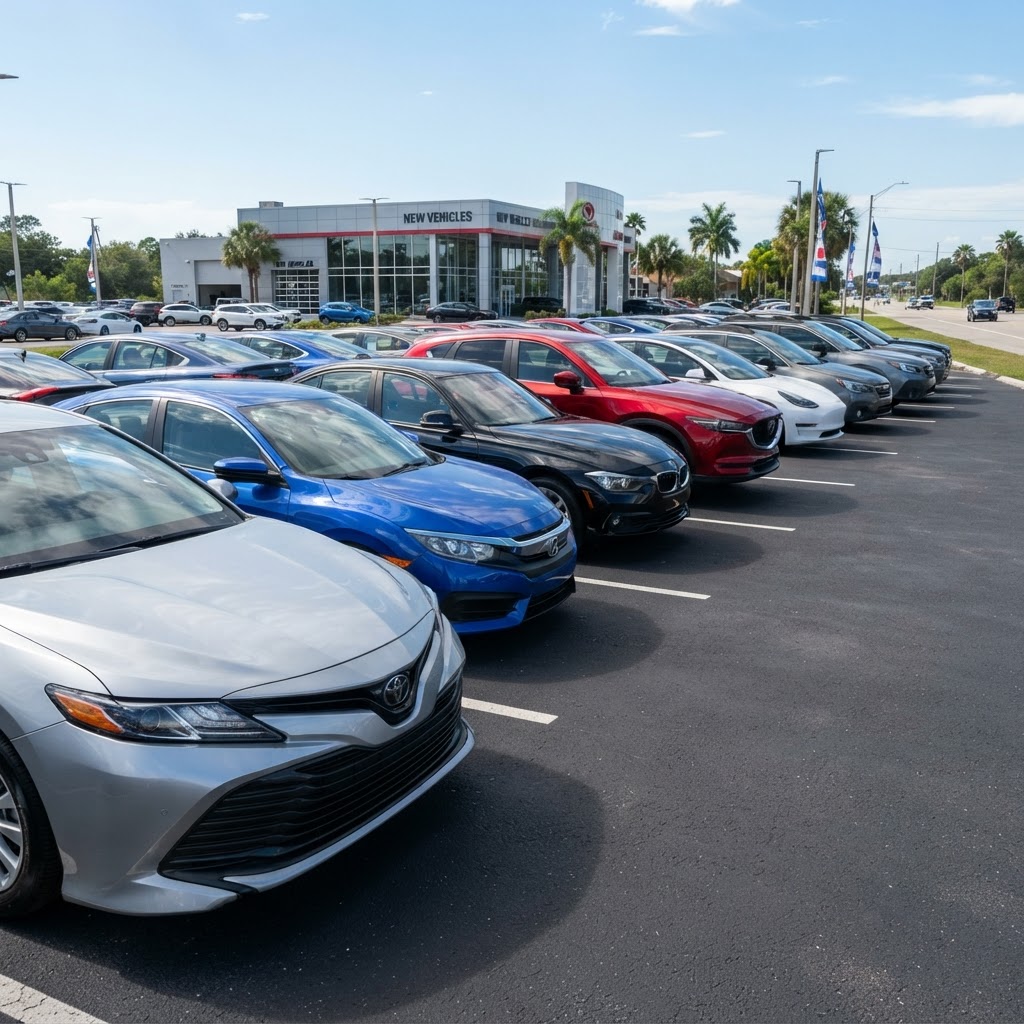
💡 Key Insight: With 1.4 billion registered vehicles globally and an average annual depreciation of $2,800 per vehicle, total global vehicle depreciation exceeds $3.9 trillion per year — one of the largest categories of consumer wealth erosion on Earth.
Understanding depreciation is critical for buyers, sellers, fleet managers, insurers, and policymakers. This report synthesises data from the International Organisation of Motor Vehicle Manufacturers (OICA), Cox Automotive, J.D. Power, Kelley Blue Book, CAP HPI, and national vehicle registration databases across 62 countries to provide the most comprehensive global depreciation analysis available in 2026.
Global Depreciation Overview 2026
The global average 5-year depreciation rate reached 48% in 2026, up from 40% in 2021 when the used-car market was inflated by pandemic-era supply shortages. As new vehicle supply normalised through 2023–2025, used car values softened and depreciation rates returned to — and slightly exceeded — pre-pandemic norms.
Global Average 5-Year Depreciation Rate (2018–2026)
% of original value lost after 5 years — global passenger vehicle average
Sources: Cox Automotive, Kelley Blue Book, CAP HPI, OICA — 2018–2026 ¹
Three macro forces are driving the 2026 depreciation environment:
- EV proliferation: Rapid model cycles and improving battery technology are accelerating obsolescence of older EVs, pushing their depreciation above the market average.
- Interest rate normalisation: Higher financing costs have reduced new car affordability, softening demand for used vehicles and increasing depreciation pressure.
- Supply chain recovery: After the 2021–2022 chip shortage inflated used car prices, normalised supply has returned depreciation to structural levels.
| Region | Avg Year-1 Loss | Avg 5-Year Loss | Market Size (M units/yr) |
|---|---|---|---|
| USA | 20% | 50% | 15.9M |
| Germany | 18% | 47% | 2.8M |
| UK | 22% | 52% | 1.9M |
| Japan | 16% | 42% | 4.8M |
| China | 24% | 58% | 30.1M |
| India | 14% | 38% | 4.2M |
| Australia | 19% | 49% | 1.1M |
| Canada | 21% | 51% | 1.7M |
| Brazil | 12% | 32% | 2.1M |
| UAE | 28% | 62% | 0.4M |
Sources: Cox Automotive, CAP HPI, JATO Dynamics, national vehicle registration data ²
Depreciation Curve: Year-by-Year Breakdown
Depreciation is not linear. The steepest losses occur in the first three years, after which the rate of decline slows significantly. This "depreciation cliff" is the primary reason financial advisors consistently recommend buying a 2–3 year old used vehicle rather than new.
Vehicle Value Retention Over 10 Years
% of original value retained — global average passenger vehicle (indexed to 100 at purchase)
Sources: Kelley Blue Book, Black Book, CAP HPI — 2026 average ³
The "depreciation cliff" between years 1 and 3 is driven by several compounding factors: the loss of new-car warranty coverage, the accumulation of mileage beyond manufacturer thresholds, and the psychological premium buyers place on a truly new vehicle. By year 5, a car has typically crossed the 60,000-mile mark — a key psychological threshold for used-car buyers.
For context, see our analysis of true cost of car ownership and how depreciation compares to other ownership costs over a 5-year period.
Depreciation by Vehicle Segment
Depreciation rates vary dramatically by vehicle segment. Pickup trucks and budget hatchbacks consistently outperform luxury sedans and EVs in value retention, driven by sustained demand, lower initial price premiums, and more stable technology cycles.
Depreciation by Segment — Year 1, 3 & 5
% of original value lost at each milestone — 2026 global averages
Sources: J.D. Power, Kelley Blue Book, CAP HPI, iSeeCars — 2026 ⁴

| Segment | Year 1 Loss | Year 3 Loss | Year 5 Loss | Verdict |
|---|---|---|---|---|
| Luxury Sedan | 22% | 42% | 55% | Worst |
| Mid-Range Sedan | 18% | 35% | 48% | Average |
| Budget Hatchback | 15% | 30% | 44% | Best |
| SUV / Crossover | 17% | 33% | 46% | Average |
| Electric Vehicle | 25% | 45% | 58% | Worst |
| Pickup Truck | 14% | 28% | 40% | Best |
| Sports Car | 20% | 38% | 50% | Average |
The pickup truck segment's strong value retention is driven by sustained commercial and recreational demand, particularly in North America and Australia. The Toyota Hilux and Ford F-150 are perennial leaders in residual value rankings globally. For a deeper dive into truck ownership economics, see our true cost of car ownership guide.
Depreciation by Country
Country-level depreciation rates reflect local market dynamics: used car demand, import regulations, fuel price sensitivity, climate conditions, and the age of the vehicle fleet. Markets with strong used-car demand (Japan, India) consistently show lower depreciation than markets with high luxury penetration or extreme climates (UAE, China).
5-Year Depreciation Rate by Country
% of original value lost after 5 years — 2026
Sources: Cox Automotive, CAP HPI, JATO Dynamics, national registration data — 2026 ⁵
🏆 Lowest Depreciation Markets
- Brazil (32%): High import duties and limited new car supply sustain used car values
- India (38%): Strong used-car demand, low new car penetration, fuel-efficient models dominate
- Japan (42%): Rigorous shaken inspection system limits older vehicle supply
⚠️ Highest Depreciation Markets
- UAE (62%): Extreme heat, luxury-heavy market, high new car turnover
- China (58%): Rapid model cycles, intense domestic competition, EV-heavy mix
- UK (52%): High running costs, diesel stigma, aggressive EV transition
Japan's low depreciation rate is partly structural: the shaken vehicle inspection system makes maintaining older cars expensive, reducing supply of used vehicles and supporting residual values. Brazil's low depreciation reflects a different dynamic — high import tariffs (up to 35%) and limited new car affordability create sustained demand for used vehicles at all price points.
For country-specific ownership cost data, explore our global car costs comparison tool covering 62 countries with fuel, insurance, and total ownership data.
Best & Worst Depreciating Models 2026
Advertisement
Model-level depreciation data reveals stark differences even within the same segment. The Toyota Land Cruiser retains 72% of its value after 5 years — while the Maserati Ghibli loses 65%. Brand reputation, reliability perception, and global demand are the dominant drivers of model-level residual values.
🏆 Best Value Retention (5 Years)
Sources: iSeeCars, Kelley Blue Book 2026 ⁶
⚠️ Worst Depreciation (5 Years)
Sources: iSeeCars, Kelley Blue Book 2026 ⁶
💡 The Luxury Depreciation Paradox
Luxury vehicles depreciate fastest because their high initial prices reflect brand premium, not just engineering cost. A $90,000 BMW 7 Series costs roughly $32,000 to manufacture — the remaining $58,000 is brand equity, dealer margin, and perceived exclusivity. As the car ages, that premium evaporates rapidly. See our luxury car costs breakdown for full ownership cost analysis.
The Porsche 911 is a notable exception in the sports car segment — its iconic status, limited production, and strong enthusiast demand have made it one of the best-performing vehicles for residual value globally. In some configurations, the 911 has actually appreciatedin value, particularly limited editions and GT variants. For investment-grade vehicles, see our guide on most expensive cars ever sold.
EV vs ICE Depreciation: The 2026 Picture
Electric vehicle depreciation has been one of the most debated topics in automotive finance since 2020. Early EVs depreciated catastrophically — the first-generation Nissan Leaf lost over 70% of its value in 5 years. By 2026, the picture is more nuanced: mainstream EVs from established brands now depreciate at rates closer to (but still above) their ICE equivalents, while early-generation models continue to suffer.
EV vs ICE 5-Year Depreciation Rate (2020–2026)
% of original value lost after 5 years — global average
Sources: Cox Automotive, iSeeCars, Kelley Blue Book, CAP HPI — 2020–2026 ⁷
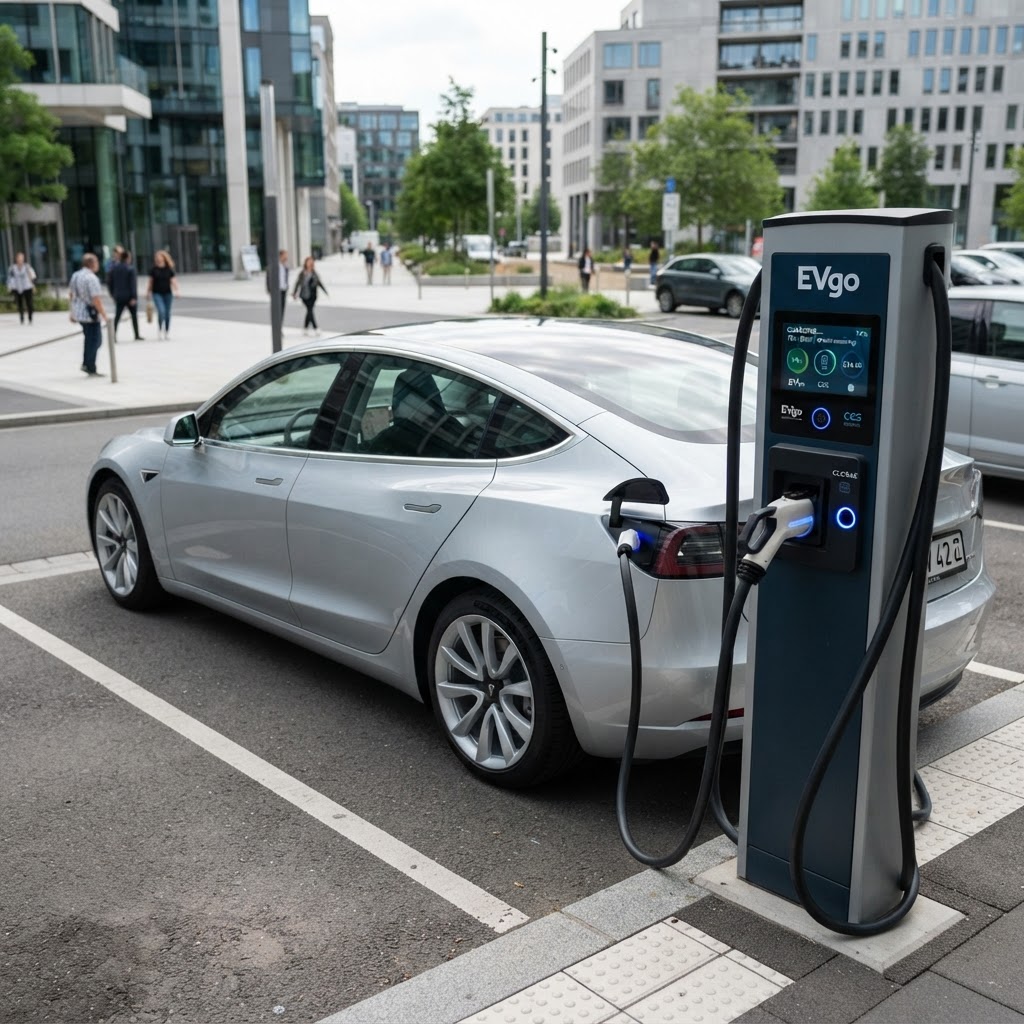
The convergence of EV and ICE depreciation rates reflects several structural improvements: battery warranties now commonly cover 8 years/100,000 miles, reducing buyer anxiety about battery replacement costs; charging infrastructure has expanded dramatically; and used EV inventory has grown sufficiently to establish reliable market pricing.
However, significant model-level variation persists. Tesla Model 3 and Model Y retain value significantly better than legacy OEM EVs, reflecting Tesla's brand strength and software update capability. Early Nissan Leafs, Chevrolet Bolts, and Renault Zoes continue to depreciate at 60–70% over 5 years.
For a comprehensive analysis of EV ownership economics, see our EV total cost of ownership guide and our EV vs gas comparison tool.
Key Factors That Drive Depreciation
Depreciation is determined by a complex interplay of factors. Understanding these allows buyers to make smarter purchasing decisions and sellers to maximise resale value.
Depreciation Factor Weighting
Source: J.D. Power Residual Value Study 2026 ⁸
1. Brand Reputation (28% of depreciation variance)
Toyota, Honda, and Porsche consistently top residual value rankings because buyers trust their reliability and longevity. A Toyota Camry and a Volkswagen Passat of similar age and mileage can differ by 15+ percentage points in residual value purely due to brand perception. J.D. Power's Vehicle Dependability Study directly correlates with 3-year residual values.
2. Mileage (22%)
Every 10,000 miles above the national average (12,000–15,000 miles/year in the US) reduces residual value by approximately 1–2%. High-mileage vehicles face compounding discounts: buyers apply both a mileage penalty and a higher perceived maintenance risk. The 60,000-mile and 100,000-mile thresholds are particularly significant psychological barriers.
3. Condition (18%)
Physical condition — paint quality, interior wear, mechanical soundness — accounts for 18% of depreciation variance. A well-maintained vehicle with service records can command a 10–15% premium over an identical model in poor condition. Paintwork damage alone can reduce value by 5–8%.
4. Market Demand (14%)
Supply and demand dynamics at the model level are critical. The 2021–2022 chip shortage demonstrated this dramatically: used car prices rose 30–40% as new car supply collapsed. In 2026, normalised supply has reversed these gains, but models with strong commercial demand (pickups, SUVs) continue to outperform.
5. Fuel Type (10%)
Diesel vehicles in Europe have faced accelerated depreciation since 2017 following emissions scandals and urban clean air zones. EVs carry a depreciation premium due to battery technology uncertainty. Hybrid vehicles have benefited from strong demand, with some models (Toyota Prius, Honda CR-V Hybrid) showing above-average residual values.
Financial Impact on Consumers
Depreciation is the invisible cost of car ownership — it doesn't appear on a monthly statement, but it is the largest single expense for most vehicle owners. Understanding its financial impact is essential for making rational car-buying decisions.
| Vehicle Price | 5-Year Depreciation | Dollar Loss | Annual Cost | Monthly Cost |
|---|---|---|---|---|
| $15,000 (Budget) | 44% | $6,600 | $1,320/yr | $110/mo |
| $25,000 (Mid-Range) | 48% | $12,000 | $2,400/yr | $200/mo |
| $35,800 (Avg New 2026) | 48% | $17,184 | $3,437/yr | $286/mo |
| $55,000 (Luxury) | 55% | $30,250 | $6,050/yr | $504/mo |
| $90,000 (Premium Luxury) | 60% | $54,000 | $10,800/yr | $900/mo |
The 3-Year Rule: Buying a 3-year-old used vehicle instead of new avoids the steepest depreciation window (years 1–3), saving an average of $13,250 on a $35,800 vehicle. The car still has 7+ years of useful life remaining, typically retains manufacturer warranty coverage through certified pre-owned programmes, and depreciates at a much slower rate going forward. See our new vs used car guide for a full financial comparison.
For fleet operators, depreciation management is a core financial discipline. A fleet of 1,000 vehicles with an average value of $35,000 faces annual depreciation costs of approximately $3.4 million — more than the combined fuel and maintenance budget for most fleets. Optimal fleet replacement cycles (typically 3–5 years) are calculated to minimise the total cost of depreciation plus maintenance, which follows a U-shaped curve.
For personal finance planning, use our car cost calculator to model total ownership costs including depreciation, or our car budget by salary guide to determine how much vehicle you can truly afford.
2027–2030 Depreciation Forecast
The depreciation landscape is set for significant structural change through 2030, driven by the accelerating EV transition, autonomous vehicle development, and shifting consumer preferences.
| Year | ICE 5-Yr Dep. | EV 5-Yr Dep. | Avg New Car Price | Key Driver |
|---|---|---|---|---|
| 2026 (actual) | 47% | 51% | $35,800 | Supply normalisation |
| 2027 | 48% | 49% | $36,900 | EV demand growth |
| 2028 | 50% | 47% | $37,800 | ICE obsolescence risk |
| 2029 | 52% | 46% | $38,500 | EV/ICE crossover |
| 2030 | 55% | 44% | $39,200 | EV parity achieved |
ICE Vehicles Face Accelerating Depreciation
As EV adoption accelerates and governments set ICE phase-out dates (UK: 2035, EU: 2035, California: 2035), ICE vehicles will face growing obsolescence risk. Buyers will increasingly discount ICE vehicles for their limited future utility, particularly in urban markets with clean air zones. We forecast ICE 5-year depreciation reaching 55% by 2030.
EV Depreciation to Improve Significantly
Battery cost reductions (projected to reach $80/kWh by 2028), expanding charging infrastructure, and growing used EV demand will drive EV residual values higher. By 2030, we forecast EV 5-year depreciation falling to 44% — below the current ICE average. Models with over-the-air update capability will retain value best.
Autonomous Vehicle Uncertainty
Level 3+ autonomous vehicles entering the market in 2027–2028 create significant residual value uncertainty for non-autonomous models. Fleet and commercial buyers may accelerate replacement cycles, increasing used vehicle supply and depressing residual values for conventional vehicles.
For buyers making long-term ownership decisions, these trends have clear implications: EVs from established brands with strong software ecosystems will increasingly be the better value-retention choice. For more on the EV transition economics, see our global EV statistics 2026 report.
📚 Citations & Data Sources
- 1.Cox Automotive. (2026). Manheim Used Vehicle Value Index 2026. Cox Automotive Inc.
- 2.JATO Dynamics. (2026). Global Vehicle Residual Value Report Q2 2026. JATO Dynamics Ltd.
- 3.Kelley Blue Book. (2026). Best Resale Value Awards 2026. Cox Automotive / KBB.
- 4.J.D. Power. (2026). U.S. Residual Value Awards 2026. J.D. Power and Associates.
- 5.CAP HPI. (2026). Used Car Market Report — UK & Europe Q2 2026. CAP HPI Ltd.
- 6.iSeeCars. (2026). Best and Worst Depreciating Cars 2026. iSeeCars.com Research.
- 7.Cox Automotive. (2026). EV Residual Value Analysis 2026. Cox Automotive Inc.
- 8.J.D. Power. (2026). Vehicle Dependability Study 2026. J.D. Power and Associates.
- 9.OICA. (2026). World Motor Vehicle Production Statistics 2025. Organisation Internationale des Constructeurs d'Automobiles.
- 10.BloombergNEF. (2026). Electric Vehicle Outlook 2026. Bloomberg Finance L.P.
- 11.IHS Markit / S&P Global Mobility. (2026). Global Vehicle Parc and Residual Value Forecast 2026.
- 12.Black Book. (2026). Used Vehicle Retention Index 2026. Hearst Business Media.
- 13.Schwacke. (2026). DAT Marktspiegel — Gebrauchtwagenmarkt Deutschland Q2 2026. DAT Group.
- 14.Auto Trader. (2026). Automotive Market Report 2026. Auto Trader Group plc.
- 15.Edmunds. (2026). True Cost to Own® Data 2026. Edmunds.com Inc.
Frequently Asked Questions
📖 Related Guides & Tools
Advertisement
Advertisement