Advertisement
📋 Table of Contents
- 2026 Global Car Market Overview
- What to Look for When Buying a Car in 2026
- Best Cars by Budget (Under $25K to Over $60K)
- EV vs Hybrid vs Petrol: Which Should You Buy?
- Most Reliable Car Brands in 2026
- Annual Fuel Costs by Country
- Best Resale Value Cars 2026
- 10 Expert Tips for Buying a Car in 2026
- Frequently Asked Questions
1. 2026 Global Car Market Overview
The global automotive market is on track to sell 95.1 million new vehicles in 2026, according to the International Organization of Motor Vehicle Manufacturers (OICA) — a record high that surpasses the pre-pandemic peak of 90.3 million units in 2019. This recovery has been driven by pent-up demand, normalising supply chains, and an explosion in electric vehicle adoption across China, Europe, and increasingly North America.
For buyers, 2026 represents one of the most competitive markets in a decade. Dealer inventories have returned to healthy levels — the average days-to-turn for new vehicles in the US is 62 days (Cox Automotive, Q2 2026), compared to just 18 days at the height of the 2021–2022 chip shortage. This means negotiating power has shifted back to buyers, with average discounts of 4–6% off MSRP now commonplace at most mainstream brands.
The average new car transaction price in the United States reached $49,758 in early 2026 — a figure that masks enormous variation across segments. A base Toyota Corolla starts at $22,550, while a fully loaded Porsche Cayenne Turbo GT tops $175,000. Understanding where your budget sits within the global market is the first step to making a smart purchase.
Global New Car Sales 2019–2026 (Millions of Units)
Source: OICA, 2026 figure is full-year forecast. Dip in 2020 reflects COVID-19 production shutdowns.
Average New Car Price by Country / Region (USD, 2026)
Sources: Cox Automotive (USA), ACEA (Europe), JATO Dynamics (global). Prices converted to USD at September 2026 exchange rates.
SUVs and crossovers now account for 48.2% of all new car sales globally — a seismic shift from just 20% in 2010. This dominance has reshaped the entire industry, with traditional sedans declining to 18.7% market share. Meanwhile, electric vehicles have surged to 18.4% of global new car sales, up from 14.2% in 2024, driven primarily by China (where EVs represent 38% of new sales) and Europe (24%).
| Segment | 2026 Share | 2022 Share | Change |
|---|---|---|---|
| SUV / Crossover | 48.2% | 42.1% | +6.1pp |
| Electric Vehicle | 18.4% | 10.2% | +8.2pp |
| Sedan / Saloon | 18.7% | 23.4% | −4.7pp |
| Pickup Truck | 14.3% | 13.8% | +0.5pp |
| Hatchback | 10.1% | 13.2% | −3.1pp |
| Minivan / MPV | 4.8% | 5.9% | −1.1pp |
| Sports Car | 2.1% | 2.4% | −0.3pp |
Source: JATO Dynamics Global Vehicle Sales Report 2026. Note: EV share is counted within other segments; figures do not sum to 100%.
Advertisement
2. What to Look for When Buying a Car in 2026
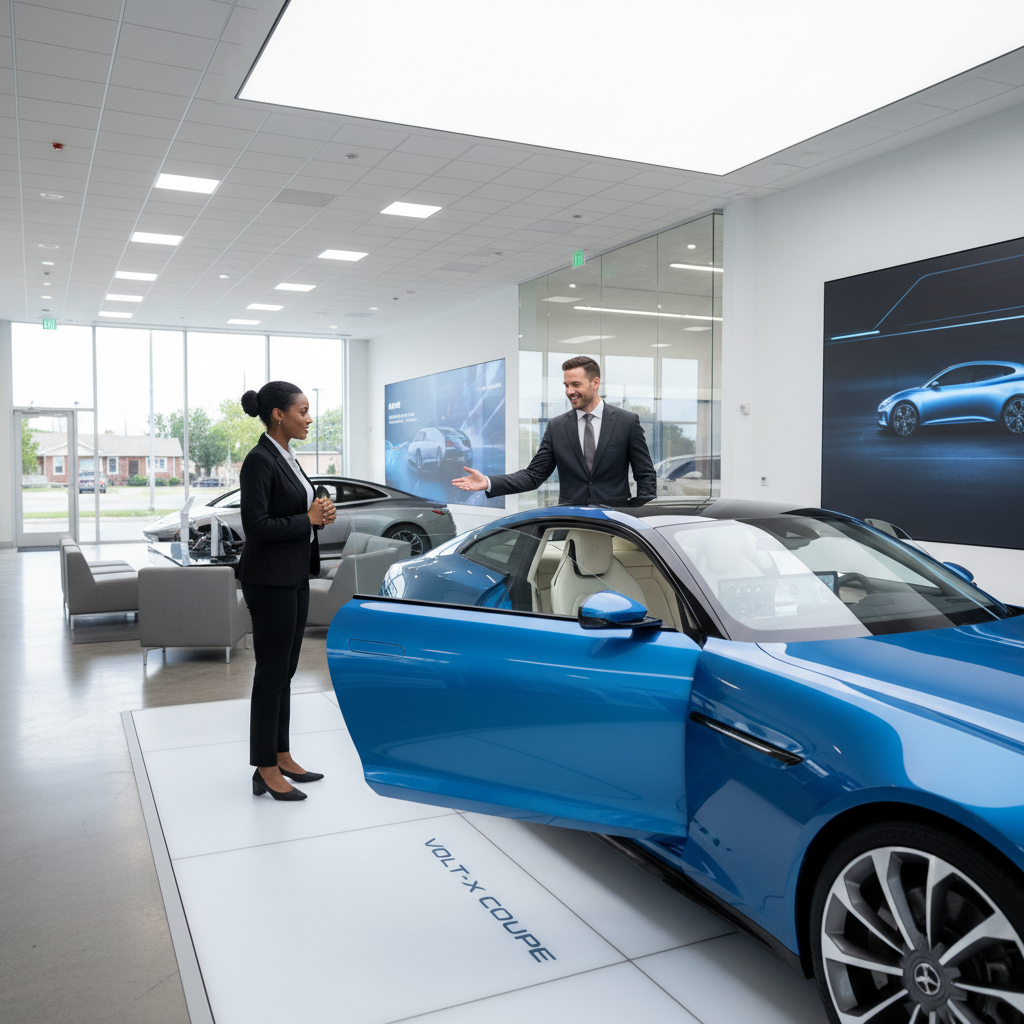
Photo: Unsplash — Car buyer at dealership
Buying a car in 2026 is more complex than ever. The proliferation of powertrains (petrol, diesel, hybrid, plug-in hybrid, full EV, hydrogen), the rise of over-the-air software updates, and the shift toward subscription-based features mean that the sticker price is only the beginning of the story. Here are the five factors that matter most:
1. Total Cost of Ownership (TCO)
The purchase price is just 40–55% of what you'll spend over 5 years. Factor in fuel/electricity, insurance, maintenance, depreciation, and financing. Our TCO Calculator shows the full 5-year picture for any car.
2. Reliability & Repair Costs
A car that breaks down frequently costs far more than its sticker price suggests. Toyota and Lexus average just 82–85 problems per 100 vehicles (J.D. Power 2026 IQS), vs 142–153 for German luxury brands. See our Budget Reliable Cars guide.
3. Depreciation & Resale Value
The average car loses 48% of its value in 5 years — a $23,880 loss on a $49,758 vehicle. Choosing a model with strong resale value (Toyota, Honda, Jeep) can save you $8,000–$12,000 vs a fast-depreciating luxury sedan. See our Global Depreciation Report.
4. Safety Ratings
In 2026, all new cars sold in the EU must have Level 2 ADAS (automatic emergency braking, lane-keep assist, driver monitoring). NHTSA 5-star and IIHS Top Safety Pick+ are the gold standards. Never buy a car without checking both ratings.
5. Powertrain Choice
Petrol, hybrid, PHEV, or full EV? The right choice depends on your annual mileage, charging access, and driving patterns. EVs break even on TCO in 3–4 years for high-mileage drivers. Hybrids offer the best compromise for most buyers in 2026.
6. Country-Specific Costs
Car ownership costs vary dramatically by country. Annual costs in Germany ($12,400) are 53% higher than in India ($8,100). Our Global Car Costs page breaks down costs for 62 countries.
3. Best Cars by Budget in 2026
Our editorial team evaluated over 200 new models available globally in 2026, scoring each on reliability, safety, fuel economy, total cost of ownership, and resale value. Here are our top picks at every price point.
| Model | Price (USD) | MPG / Range | Reliability | Why Buy |
|---|---|---|---|---|
| Toyota Corolla | $22,550 | 38 MPG | Excellent | Best overall value under $25K |
| Honda Civic | $23,950 | 36 MPG | Excellent | Best driver's car under $25K |
| Mazda3 | $24,100 | 35 MPG | Excellent | Best premium feel under $25K |
| Hyundai Elantra | $21,500 | 37 MPG | Very Good | Best tech features under $25K |
💡 Editor's Pick 2026: The Toyota RAV4 Hybrid ($32,800) is our single best car recommendation for most buyers globally. It combines Toyota's legendary reliability, 41 MPG combined fuel economy, a 5-star NHTSA safety rating, and 61% 5-year resale value — all at a price that represents genuine value in the current market. For buyers who want to explore full ownership costs, use our TCO Calculator.
5-Year Total Cost of Ownership — Top Value Picks 2026 (USD)
Source: AAA, RACQ, CAA 2026 ownership cost studies. TCO includes depreciation, fuel, insurance, maintenance, and financing at 6.5% APR.
Advertisement
4. EV vs Hybrid vs Petrol: Which Should You Buy in 2026?
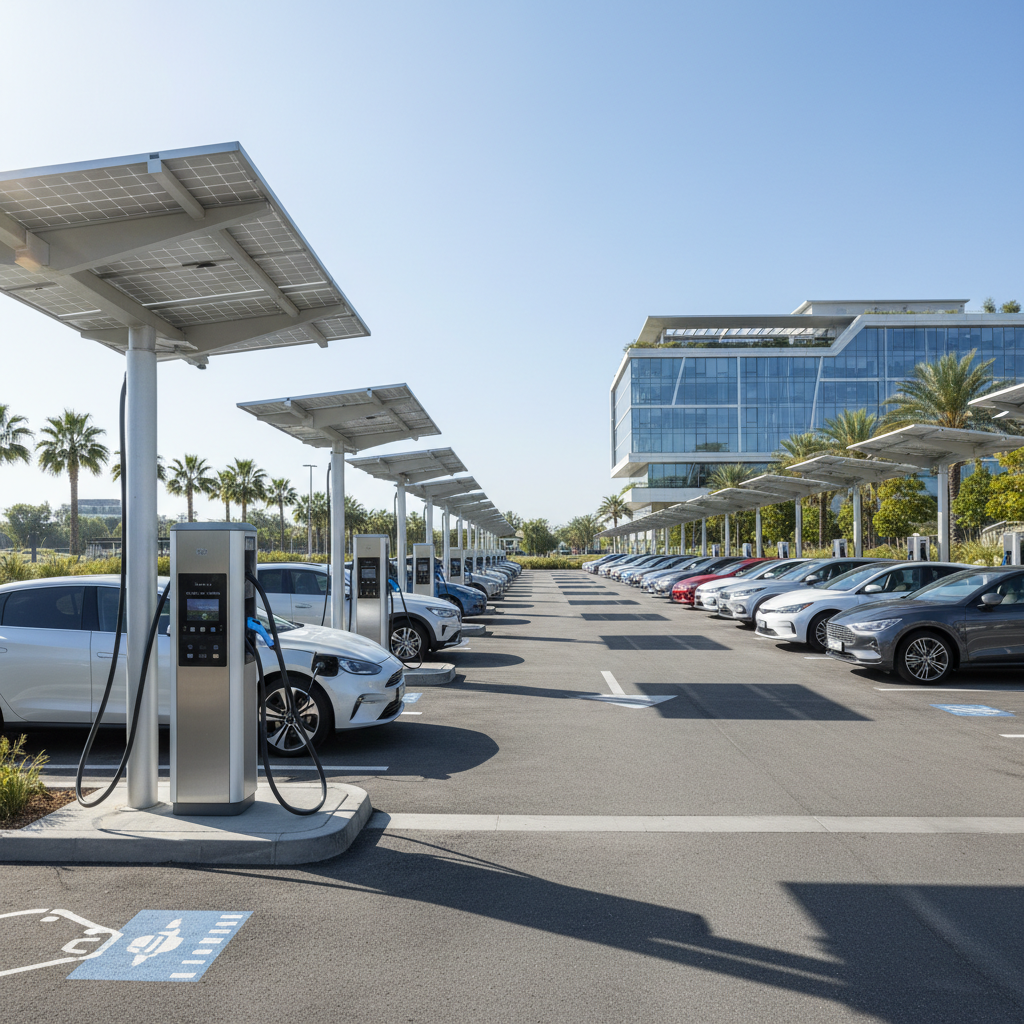
Photo: Unsplash — EV charging station
The powertrain decision is the most consequential choice you'll make when buying a car in 2026. Electric vehicles now represent 18.4% of global new car sales, but they're not right for every buyer. Here's the definitive breakdown:
Full Electric (EV)
✅ PROS
- • $1,400–$2,700/yr fuel savings vs petrol
- • Lower maintenance (no oil changes, fewer brake jobs)
- • Zero tailpipe emissions
- • Instant torque, smooth driving experience
- • Growing charging infrastructure
❌ CONS
- • Higher purchase price (+$8,000–$15,000 vs equivalent ICE)
- • Range anxiety on long trips
- • Slower depreciation improvement (51% 5-yr loss)
- • Requires home charging for best economics
- • Battery replacement risk ($8,000–$20,000)
Hybrid (HEV)
✅ PROS
- • 38–45 MPG combined (Toyota/Honda)
- • No range anxiety — fill up anywhere
- • Lower TCO than petrol for most buyers
- • Excellent reliability (Toyota hybrid system 300K+ miles)
- • Strong resale value
❌ CONS
- • Higher purchase price vs petrol (+$2,000–$5,000)
- • No EV-only range (unlike PHEV)
- • Less exciting to drive than EV
- • Battery replacement eventually ($2,000–$4,000)
Petrol / Diesel
✅ PROS
- • Lowest purchase price
- • Widest model choice
- • Fastest refuelling
- • Proven technology
- • Cheapest in low-fuel-cost countries
❌ CONS
- • Highest annual fuel costs
- • Rising fuel prices risk
- • Increasing regulatory pressure (EU 2035 ban)
- • Higher maintenance than hybrid long-term
- • Worst environmental impact
Annual Ownership Cost: EV vs ICE (USD, 15,000 miles/yr)
Source: BloombergNEF EV Outlook 2026, AAA Your Driving Costs 2026. Assumes $0.14/kWh home charging, $3.45/gallon US average. EV: Tesla Model Y; ICE: Toyota RAV4.
The data is clear: EVs become cheaper to own than equivalent ICE vehicles by Year 3 for drivers covering 15,000+ miles per year with home charging. However, for drivers covering under 8,000 miles per year, the higher purchase price of an EV means it may never fully pay back. For a detailed comparison tailored to your situation, use our EV vs Gas Comparison tool.
The plug-in hybrid (PHEV) represents a compelling middle ground for 2026 buyers. Models like the Toyota RAV4 Prime ($43,090) offer 42 miles of EV-only range — enough for most daily commutes — while retaining a full petrol engine for long trips. PHEVs qualify for federal tax credits in the US (up to $7,500) and similar incentives in Europe, making them highly competitive on total cost.
⚠️ EV Depreciation Warning
EVs still depreciate faster than equivalent ICE vehicles — 51% vs 47% over 5 years globally (2026 data). The Nissan Leaf (2021 model) has lost 60% of its value in 5 years. If you're buying an EV, prioritise models with strong brand support and proven battery longevity (Tesla, Toyota bZ4X, Hyundai IONIQ 6). Read our full Vehicle Depreciation Report for model-by-model data.
5. Most Reliable Car Brands in 2026
Reliability is the single most important factor in long-term ownership satisfaction — and cost. A car that requires frequent repairs can easily cost $3,000–$8,000 more over 5 years than a reliable alternative. The data below combines J.D. Power's 2026 Initial Quality Study (IQS), Consumer Reports reliability scores, and RepairPal data.
Brand Reliability Score 2026 (100 = Perfect, Higher = Better)
Sources: J.D. Power 2026 IQS, Consumer Reports 2026 Annual Auto Reliability Survey, RepairPal Brand Reliability Ratings. Score is composite index.
| Rank | Brand | Reliability Score | Problems/100 Vehicles | Avg Annual Repair Cost | Rating |
|---|---|---|---|---|---|
| #1 | Toyota | 94/100 | 82 | $441 | Excellent |
| #2 | Lexus | 93/100 | 85 | $551 | Excellent |
| #3 | Mazda | 91/100 | 91 | $462 | Excellent |
| #4 | Honda | 89/100 | 97 | $428 | Very Good |
| #5 | Subaru | 87/100 | 103 | $617 | Very Good |
| #6 | Hyundai | 85/100 | 108 | $468 | Very Good |
| #7 | Kia | 84/100 | 112 | $474 | Good |
| #8 | Ford | 79/100 | 128 | $775 | Good |
| #9 | Chevrolet | 77/100 | 134 | $649 | Good |
| #10 | BMW | 74/100 | 142 | $968 | Fair |
| #11 | Mercedes | 72/100 | 149 | $908 | Fair |
| #12 | Audi | 71/100 | 153 | $987 | Fair |
Sources: J.D. Power 2026 IQS, Consumer Reports 2026, RepairPal. Annual repair cost = average unscheduled repair cost per year.
The reliability gap between Japanese and German brands remains stark in 2026. A Toyota owner spends an average of $441/year on unscheduled repairs, while an Audi owner spends $987/year — a $546 annual difference that compounds to over $2,700 across a 5-year ownership period. This is before accounting for the higher parts and labour costs associated with German vehicles.
For buyers considering a used car, reliability data becomes even more critical. Our Budget Reliable Cars guide identifies the best used vehicles under $15,000 that combine low repair costs with strong safety ratings.
Advertisement
6. Annual Fuel Costs by Country: Petrol vs EV vs Hybrid
Fuel costs are the second-largest component of car ownership after depreciation, and they vary enormously by country. A driver in Germany pays 3.4× more per year in petrol costs than a driver in the USA, simply due to fuel tax differences. This makes the EV value proposition far stronger in Europe than in North America.
Annual Fuel Cost by Country & Powertrain (USD, 15,000 miles/yr)
Sources: IEA Global EV Outlook 2026, GlobalPetrolPrices.com (Sep 2026), EIA (USA). Assumes 15,000 miles/24,000 km per year. EV assumes home charging at local residential electricity rate.
The fuel savings from choosing an EV or hybrid are most dramatic in high-fuel-cost countries. In Germany, switching from petrol to EV saves $2,300/year in fuel alone — enough to offset the EV premium in under 5 years even before accounting for lower maintenance costs. In the USA, the annual fuel saving is $1,420 (EV vs petrol) or $900 (hybrid vs petrol).
For a detailed breakdown of car ownership costs in your specific country, visit our Global Car Costs page covering 62 countries, or explore individual country pages for USA, Germany, UK, and Australia.
7. Best Resale Value Cars 2026
Depreciation is the single largest cost of car ownership — accounting for 35–45% of total 5-year ownership costs. Choosing a car with strong resale value can save you $8,000–$15,000 over 5 years compared to a fast-depreciating alternative at the same purchase price.
| Model | MSRP (USD) | 5-Yr Retained Value | 5-Yr Value Loss | Annual Depreciation |
|---|---|---|---|---|
| Toyota Land Cruiser | $57,650 | 72% | 28% | $3,228/yr |
| Porsche 911 | $106,100 | 70% | 30% | $6,366/yr |
| Toyota Hilux | $38,900 | 68% | 32% | $2,490/yr |
| Jeep Wrangler | $34,995 | 65% | 35% | $2,450/yr |
| Toyota RAV4 Hybrid | $32,800 | 61% | 39% | $2,558/yr |
| Honda CR-V Hybrid | $34,500 | 60% | 40% | $2,760/yr |
| Ford F-150 | $36,000 | 61% | 39% | $2,808/yr |
| Toyota Corolla | $22,550 | 60% | 40% | $1,804/yr |
Sources: iSeeCars 2026 Best Resale Value Report, Kelley Blue Book, CAP HPI (UK). 5-year retained value = % of original MSRP retained after 5 years / 60,000 miles.
The Toyota Land Cruiser retains an extraordinary 72% of its value after 5 years — the highest of any mainstream vehicle globally. This is driven by its legendary off-road capability, near-indestructible reliability, and strong demand in markets from Australia to the Middle East. At $57,650 MSRP, it loses just $3,228/year to depreciation — less than a $22,550 Hyundai Elantra.
For the full global depreciation analysis including worst-depreciating models (BMW 7 Series, Maserati Ghibli, Jaguar XF), read our Global Vehicle Depreciation Statistics 2026 report.
8. 10 Expert Tips for Buying a Car in 2026

Photo: Unsplash — Car dealership negotiation
Get Pre-Approved for Financing Before You Visit a Dealership
Dealers make significant profit on financing. Getting pre-approved from your bank or credit union (typically 0.5–1.5% lower APR than dealer financing) gives you negotiating power and a clear budget ceiling. In 2026, average new car loan APR is 7.1% (Experian); credit unions average 5.8%.
Shop at End of Month, Quarter, or Model Year
Dealers have monthly and quarterly sales targets. Shopping in the last 3 days of a month — especially the last month of a quarter (March, June, September, December) — can yield additional discounts of 2–4% as salespeople push to hit targets. End-of-model-year clearance (typically August–October) offers the deepest discounts.
Always Calculate Total Cost of Ownership, Not Just Monthly Payment
Dealers often focus on monthly payments to obscure the true cost. A $600/month payment over 72 months costs $43,200 — potentially $8,000+ more than a 48-month loan at $750/month. Use our Car Loan Calculator to compare total costs.
Check the Invoice Price, Not Just MSRP
The invoice price (what the dealer paid the manufacturer) is typically 3–8% below MSRP. Websites like TrueCar, Edmunds, and CarGurus publish invoice prices. Negotiating from invoice rather than MSRP can save $1,500–$4,000 on a $40,000 vehicle.
Verify All Safety Ratings Before Buying
Check both NHTSA (nhtsa.gov) and IIHS (iihs.org) ratings. A car can have 5 NHTSA stars but fail the IIHS small overlap test — a critical real-world crash scenario. Only buy cars with IIHS Top Safety Pick+ or equivalent ratings in your market.
Research Reliability Before Falling in Love with a Model
Consumer Reports, J.D. Power, and RepairPal publish annual reliability data. A car that scores poorly in reliability will cost you significantly more over 5 years. The difference between a Toyota (94/100) and a German luxury brand (71–74/100) can mean $2,500–$5,000 in additional repair costs.
Negotiate the Trade-In Separately from the New Car Purchase
Dealers bundle trade-in and new car negotiations to obscure the true value of each. Get your trade-in appraised separately at CarMax, Carvana, or a competing dealer first. Then negotiate the new car price independently. This prevents dealers from "giving" you more on the trade-in while reducing the new car discount.
Understand EV Incentives in Your Country
Federal EV tax credits in the USA (up to $7,500), UK Plug-in Car Grant (up to £2,500), and European national incentives can significantly reduce the effective purchase price of an EV or PHEV. Check eligibility carefully — income limits and vehicle price caps apply in most markets.
Get an Independent Pre-Purchase Inspection for Used Cars
A $100–$200 pre-purchase inspection by an independent mechanic can reveal $5,000–$20,000 in hidden problems. This is non-negotiable for any used car purchase. Even certified pre-owned (CPO) vehicles benefit from independent inspection.
Consider the Full Insurance Cost Before Buying
Insurance costs vary dramatically by model. A BMW M3 can cost 3× more to insure than a Toyota Camry. Get insurance quotes for any car you're seriously considering before signing. Our Car Insurance Guide explains how to minimise premiums.
Data Sources & Citations
- Cox Automotive. (2026). Kelley Blue Book Average Transaction Price Report Q2 2026. Cox Automotive Inc.
- OICA. (2026). World Motor Vehicle Production Statistics 2026. Organisation Internationale des Constructeurs d'Automobiles.
- J.D. Power. (2026). 2026 U.S. Initial Quality Study (IQS). J.D. Power and Associates.
- Consumer Reports. (2026). 2026 Annual Auto Reliability Survey. Consumer Reports Inc.
- AAA. (2026). Your Driving Costs: How Much Are You Really Paying to Drive? American Automobile Association.
- BloombergNEF. (2026). Electric Vehicle Outlook 2026. BloombergNEF.
- JATO Dynamics. (2026). Global Car Sales Report H1 2026. JATO Dynamics Ltd.
- iSeeCars. (2026). Best Resale Value Cars 2026: Which Cars Hold Their Value Best? iSeeCars.com.
- Experian. (2026). State of the Automotive Finance Market Q2 2026. Experian Automotive.
- IEA. (2026). Global EV Outlook 2026. International Energy Agency.
- IIHS. (2026). 2026 Top Safety Pick and Top Safety Pick+ Awards. Insurance Institute for Highway Safety.
- NHTSA. (2026). New Car Assessment Program (NCAP) 2026 Results. National Highway Traffic Safety Administration.
- GlobalPetrolPrices.com. (September 2026). Gasoline and Electricity Prices by Country.
- RepairPal. (2026). Car Reliability Ratings and Annual Repair Cost Data. RepairPal Inc.
- Edmunds. (2026). True Cost to Own® (TCO®) Data 2026. Edmunds.com.
Advertisement