
Advertisement
1. Global Fuel Consumption Overview 2026
The world's vehicles consumed an estimated 100.8 million barrels of oil equivalent per day in 2026, according to the International Energy Agency (IEA). Road transport alone accounts for 57% of total global oil demand — a figure that has remained remarkably stable even as electric vehicles gain market share. The global vehicle fleet now stands at approximately 1.6 billion vehicles, up from 1.4 billion in 2020, driven primarily by rapid motorisation in South and Southeast Asia.
Despite the accelerating EV transition, total fuel consumption has only marginally declined from its 2024 peak of 102.1 million barrels per day. This paradox — more EVs yet stable fuel demand — is explained by the rebound effect: as fuel costs fall due to efficiency gains, consumers drive more miles and purchase larger vehicles. The average new vehicle sold globally in 2026 weighs 4.2% more than in 2020, with SUVs and pickup trucks now representing 52% of all new vehicle sales globally, up from 39% in 2018.
The economic stakes are enormous. Global spending on vehicle fuel reached $3.8 trillion in 2025, representing roughly 4.1% of global GDP. For the average household in a high-income country, fuel costs consume 3–5% of disposable income; in lower-income nations, this figure can exceed 12%. Understanding where, how, and why fuel is consumed is therefore not merely an environmental question — it is a fundamental economic and social issue. For a deeper look at how fuel costs affect total vehicle ownership, see our True Cost of Car Ownership guide.
Regional Fuel Consumption Share (2026)
Million barrels of oil equivalent per day, by region. Source: IEA World Energy Outlook 2026.
Figure 1: Asia-Pacific dominates global vehicle fuel consumption at 38.6 million barrels per day, followed by North America at 28.4 Mbbl/day. Africa remains the smallest consumer at 3.2 Mbbl/day but is the fastest-growing region.

The global vehicle fleet — a mix of internal combustion and electric — now totals 1.6 billion units. Photo: Unsplash
2. Regional Breakdown: Who Consumes the Most?
Asia-Pacific is the world's largest vehicle fuel consumer, accounting for 38.3% of global road transport energy demand. China alone consumes approximately 16.2 million barrels per day — more than the entire European Union. India's consumption has surged to 5.8 Mbbl/day as its vehicle fleet expanded by 34% between 2020 and 2026, driven by rising middle-class incomes and urbanisation. Southeast Asia — particularly Indonesia, Vietnam, and Thailand — adds a further 6.4 Mbbl/day, predominantly from two-wheelers and light commercial vehicles.
North America remains the most fuel-intensive region on a per-capita basis. The United States consumes 9.3 million barrels per day for road transport — roughly 9.2% of global supply — despite having only 4.2% of the world's population. This reflects the nation's car-dependent urban design, long average commute distances (27.6 minutes one-way in 2026), and the dominance of fuel-hungry pickup trucks and SUVs. Canada and Mexico contribute a further 2.1 and 1.4 Mbbl/day respectively.
Europe has made the most dramatic efficiency gains. EU-27 road transport consumption fell from 16.8 Mbbl/day in 2018 to 14.2 Mbbl/day in 2026 — a 15.5% reduction — driven by stringent CO₂ standards, high fuel taxes averaging €0.62/litre, and the fastest EV adoption outside of China. Norway, where EVs represent 88% of new car sales, has seen road fuel consumption fall by 31% since 2019.
Africa is the smallest consumer today but the fastest-growing. Vehicle ownership rates are rising at 6.8% annually — three times the global average — as urbanisation accelerates. The continent's vehicle fleet is dominated by used imports averaging 12–15 years old, with fuel efficiency far below modern standards. Without intervention, African road fuel demand could double by 2035. For context on how global car costs vary by region, see our Global Car Costs overview.
| Region | Consumption (Mbbl/day) | Global Share | YoY Change |
|---|---|---|---|
| Asia-Pacific | 38.6 | 38.3% | +1.2% |
| North America | 28.4 | 28.2% | -0.4% |
| Europe | 14.2 | 14.1% | -1.8% |
| Middle East | 8.9 | 8.8% | +2.1% |
| Latin America | 6.7 | 6.6% | +0.9% |
| Africa | 3.2 | 3.2% | +4.3% |
| Other | 0.8 | 0.8% | +0.3% |
Table 1: Regional vehicle fuel consumption 2026. Source: IEA, OPEC World Oil Outlook 2026.
3. Fuel Type Distribution Worldwide
Gasoline (petrol) remains the dominant vehicle fuel globally, powering 48% of the world's vehicle fleet by energy consumed. Diesel accounts for 29%, reflecting its dominance in commercial transport, freight, and European passenger cars. Together, these two fossil fuels still account for 77% of all vehicle energy consumption — a figure that has declined from 89% in 2018 but remains overwhelmingly dominant.
Electric vehicles now represent 12% of vehicle energy consumption globally — a figure that understates their fleet share (approximately 5.8% of all registered vehicles) because EVs are driven more miles annually than average. Hybrid vehicles contribute 7%, with plug-in hybrids (PHEVs) accounting for roughly half of that. LPG and CNG vehicles, common in Italy, Turkey, Iran, and parts of South Asia, contribute 3%. Hydrogen fuel cell vehicles remain negligible at under 0.1% of global consumption.
Fuel Type Share of Vehicle Energy (2026)
By percentage of total vehicle energy consumed. Source: IEA.
EV Adoption by Country (% of New Sales, 2026)
Norway leads at 88.2%. Source: EV-Volumes, IEA.
Figure 2: Gasoline and diesel still dominate at 77% combined. Norway's 88.2% EV new-sales share demonstrates what aggressive policy can achieve.
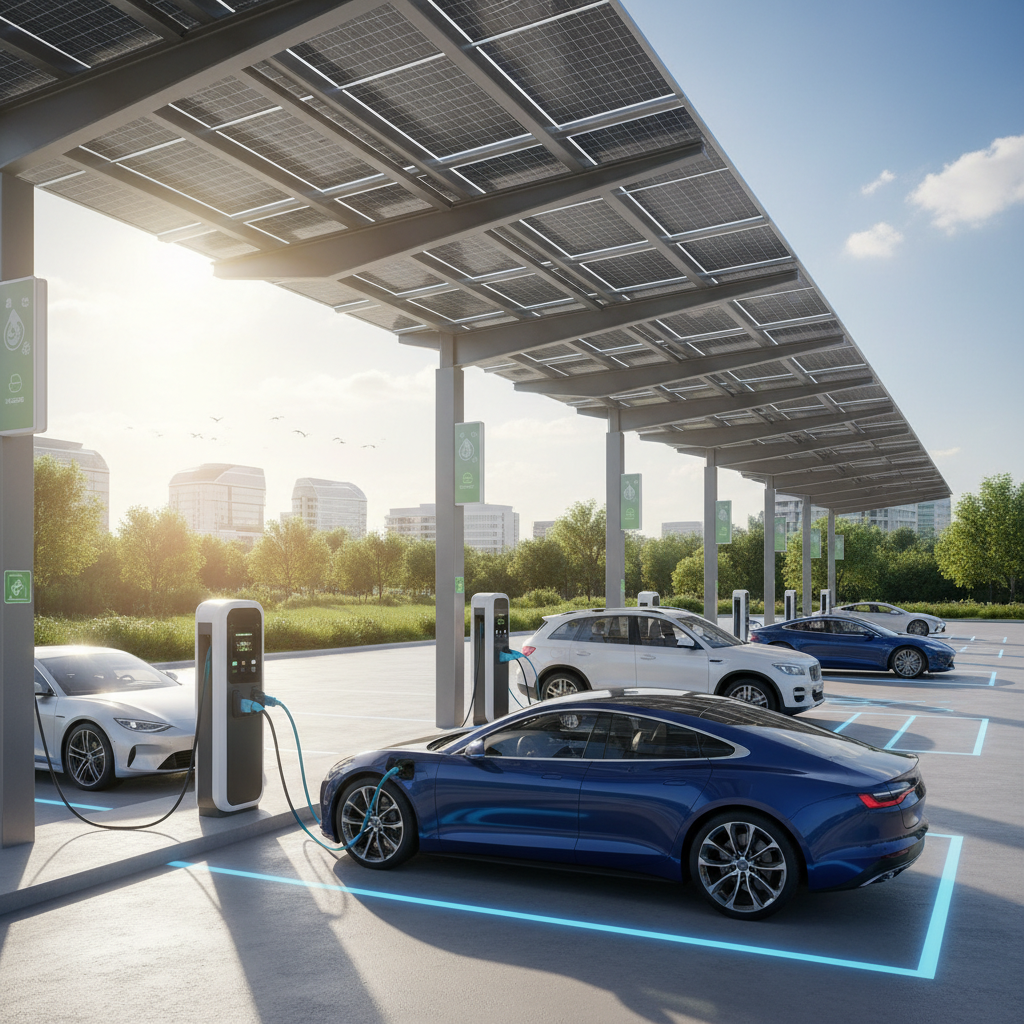
EV charging infrastructure is expanding rapidly, but fossil fuels still power 77% of global vehicle energy. Photo: Unsplash
4. Vehicle Fuel Efficiency by Country
Fuel efficiency — measured in miles per gallon (MPG) or litres per 100 km — varies dramatically across nations, reflecting differences in vehicle mix, regulatory standards, and consumer preferences. Japan leads the world with a fleet-average of 42.6 MPG, the result of decades of stringent fuel economy standards under the Top Runner programme and a cultural preference for compact, efficient vehicles. The EU average of 38.4 MPG reflects the bloc's CO₂ fleet standards, which require new cars to emit no more than 95g CO₂/km.
The United States lags significantly at 26.4 MPG fleet average — the lowest among major developed economies. The CAFE (Corporate Average Fuel Economy) standards, set at 49 MPG for model year 2026 passenger cars, have been partially offset by the consumer shift to light trucks and SUVs, which face a lower standard of 36 MPG. The net result is that despite regulatory progress, the average American vehicle burns 36% more fuel per mile than its Japanese counterpart.
India and Brazil present a different challenge: their fleets are relatively efficient on paper (24.9 and 22.1 MPG respectively) but are dominated by older vehicles with poor maintenance, real-world fuel consumption often 20–30% worse than rated. India's CAFE standards, introduced in 2017 and tightened in 2022, have improved new vehicle efficiency but the average fleet age of 9.4 years means the full benefit will take a decade to materialise. For more on how fuel costs affect total car ownership, see our EV vs Gas comparison.
Fleet-Average Fuel Efficiency by Country (MPG, 2026)
Combined fleet average including all vehicle types. Source: ICCT Global Fuel Economy Initiative 2026.
Figure 3: Japan (42.6 MPG) and the EU (38.4 MPG) lead on efficiency. The USA (26.4 MPG) and Brazil (22.1 MPG) trail significantly, reflecting vehicle mix and regulatory differences.
5. CO₂ Emissions by Vehicle Type
Advertisement
Road transport emitted approximately 6.0 gigatonnes of CO₂ in 2025, representing 16.2% of total global greenhouse gas emissions and 23% of energy-related CO₂. This makes the transport sector the second-largest source of energy-related emissions globally, behind only electricity and heat generation. Despite the EV transition, transport emissions have grown 8% since 2015 — driven by the expansion of the global vehicle fleet outpacing efficiency gains.
Heavy trucks are the most carbon-intensive vehicle category at 118g CO₂ per vehicle-kilometre, reflecting their size and diesel dependency. SUVs (94g CO₂/vkm) and pickup trucks (88g CO₂/vkm) are the fastest-growing contributors to passenger vehicle emissions — the IEA estimates that the global shift to SUVs added an extra 0.4 Gt CO₂ annually between 2018 and 2026 compared to a scenario where the sedan remained dominant.
Electric vehicles emit approximately 8g CO₂ per vehicle-kilometre on a lifecycle basis in 2026 — accounting for manufacturing emissions and the carbon intensity of the electricity grid. This is 85% lower than the average new gasoline car (54g CO₂/vkm). However, in countries where electricity is predominantly coal-generated (India, Poland, South Africa), the lifecycle advantage narrows to 40–55%. As grids decarbonise, the EV advantage will grow automatically without any change to the vehicles themselves. To understand how EV costs compare to gas vehicles in practice, see our EV Total Cost of Ownership guide.
CO₂ Emissions by Vehicle Type (g CO₂/vehicle-km, 2026)
Lifecycle emissions including manufacturing and fuel/electricity production. Source: ICCT, IEA.
Figure 4: EVs emit 8g CO₂/vkm vs 54g for sedans and 94g for SUVs. Heavy trucks remain the most carbon-intensive category at 118g CO₂/vkm.

Road transport emits 6.0 Gt CO₂ annually — 16.2% of global greenhouse gas emissions. Photo: Unsplash
6. The EV Transition & Its Impact on Fuel Demand
The electric vehicle revolution is reshaping global fuel demand in ways that are simultaneously faster and slower than analysts predicted. Global EV sales reached 22.4 million units in 2025, representing 24.8% of all new vehicle sales — up from just 2.5% in 2019. The global EV fleet now stands at approximately 92 million vehicles, displacing an estimated 1.8 million barrels of oil demand per day compared to a counterfactual all-ICE scenario.
Yet total fuel demand has not collapsed. The reason is the fleet turnover problem: with 1.6 billion vehicles on the road and annual new sales of approximately 90 million units, it takes roughly 18 years to turn over the entire global fleet. Even if 100% of new sales were EVs from today, the last combustion engine vehicle would not leave the road until approximately 2044. In practice, the IEA's central scenario projects that global road fuel demand will peak around 2028 and decline gradually thereafter.
The geographic concentration of EV adoption creates additional complexity. China accounts for 58% of global EV sales and 61% of the global EV fleet. Europe accounts for 22%. The United States, despite being the world's second-largest vehicle market, accounts for only 11% of global EV sales. In contrast, the entire developing world — home to 85% of the global population and the fastest-growing vehicle markets — accounts for less than 9% of EV sales. This means the fuel demand reduction from EVs is concentrated in regions that were already reducing consumption, while the fastest-growing fuel markets remain almost entirely ICE-dependent.
Global Fuel Consumption vs EV Share Trend (2010–2026)
Total road fuel consumption (Mbbl/day) and EV share of new sales (%). Source: IEA, EV-Volumes.
Figure 5: EV share has risen from 0.1% in 2010 to 18.2% in 2026, yet total fuel consumption has only declined modestly from its 2024 peak — illustrating the fleet turnover challenge.
7. Fuel Price Trends and Consumption Elasticity
The relationship between fuel prices and consumption is complex and asymmetric. The global average retail gasoline price stood at $3.18 per gallon (USD equivalent) in 2026, down from the 2022 peak of $3.95/gallon driven by the Russia-Ukraine conflict's impact on energy markets. However, this global average masks enormous variation: Norwegian drivers pay the equivalent of $8.20/gallon after taxes, while Saudi Arabian drivers pay $0.62/gallon due to subsidies.
Economic research consistently finds that the short-run price elasticity of fuel demand is approximately -0.15 to -0.25 — meaning a 10% price increase reduces consumption by only 1.5–2.5% in the short term. In the long run (3–5 years), elasticity rises to -0.6 to -0.8 as consumers adjust vehicle choices and travel patterns. This explains why the 2022 price spike caused only a modest 2.3% reduction in global consumption, while the sustained high prices of 2022–2024 contributed to a more meaningful 3.8% efficiency improvement in new vehicle sales.
Fuel subsidies remain a major distortion in global markets. The IMF estimates that explicit and implicit fossil fuel subsidies totalled $7.0 trillion globally in 2022 — equivalent to 7.1% of global GDP. Explicit subsidies (below-market retail prices) are concentrated in the Middle East, North Africa, and parts of Asia. Implicit subsidies (failure to price carbon and other externalities) are universal. Removing these subsidies would, according to IMF modelling, reduce global CO₂ emissions by 43% and raise $4.4 trillion in government revenue annually. For a practical look at how fuel costs affect your vehicle budget, try our EV vs Fuel Cost Calculator.
Global Average Fuel Price vs Consumption (2020–2026)
USD/gallon global average vs total road fuel consumption (Mbbl/day). Source: IEA, EIA, World Bank.
Figure 6: The 2022 price spike to $3.95/gallon caused only a modest consumption dip, illustrating low short-run price elasticity. Prices have since moderated to $3.18/gallon in 2026.
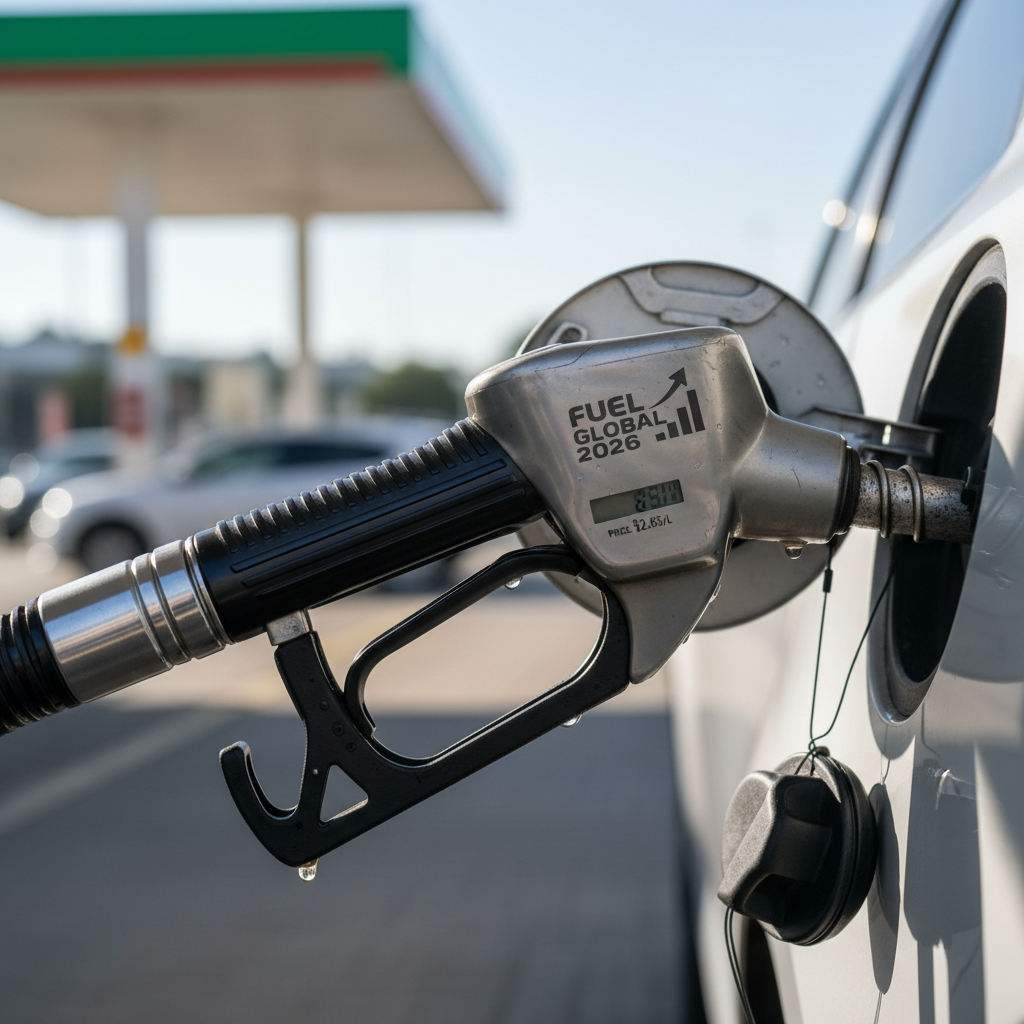
Global average fuel prices fell to $3.18/gallon in 2026, but subsidies and taxes create vast regional disparities. Photo: Unsplash
8. Emerging Markets: The Next Fuel Demand Frontier
The future of global fuel demand will be written in the developing world. The IEA projects that 90% of net new vehicle demand between 2026 and 2035 will come from non-OECD countries — primarily India, Southeast Asia, Sub-Saharan Africa, and Latin America. India alone is expected to add 200 million vehicles to its fleet by 2035, surpassing the United States as the world's second-largest vehicle market by 2030.
The critical question is whether this growth will follow the high-carbon path of 20th-century motorisation or leapfrog to cleaner technologies. The evidence is mixed. China's experience demonstrates that rapid EV adoption is possible in a developing economy with the right industrial policy — but China's success required $57 billion in EV subsidies between 2009 and 2022, a level of state investment that most developing nations cannot replicate.
Two-wheelers and three-wheelers deserve special attention in this context. In India, Indonesia, Vietnam, and much of Africa, motorcycles and scooters outnumber cars by 3:1 or more. These vehicles are individually less fuel-intensive than cars but collectively consume significant quantities of fuel and emit disproportionate quantities of particulate matter and NOx. Electric two-wheelers are already cost-competitive in many markets — China has 350 million electric two-wheelers on the road — and represent the most tractable near-term opportunity for fuel demand reduction in emerging markets. For a broader look at how car costs vary globally, see our Global Car Costs page.
Key Insight: The Two-Wheeler Opportunity
China's 350 million electric two-wheelers displace an estimated 0.8 million barrels of oil per day — more than the entire EV car fleet in the United States. Electrifying two-wheelers in South and Southeast Asia could reduce global fuel demand by a further 1.2 Mbbl/day by 2030 at a fraction of the cost of car electrification.
9. Policy Landscape: Efficiency Standards & Mandates
Fuel economy and emissions standards are the primary policy lever for reducing vehicle fuel consumption. The European Union's CO₂ fleet standard — requiring zero-emission new car sales by 2035 — is the world's most ambitious, effectively mandating a complete transition to EVs for new passenger cars within a decade. The UK has adopted an equivalent Zero Emission Vehicle (ZEV) mandate. California's Advanced Clean Cars II rule, adopted by 17 US states, requires 100% ZEV new car sales by 2035.
The United States federal CAFE standards, while less stringent than European rules, cover a larger market. The EPA's 2026 standards require a fleet average of 49 MPG for passenger cars and 36 MPG for light trucks — a 25% improvement over 2020 levels. The Biden administration's 2024 rule tightened standards further, requiring 58 MPG by 2032, though the regulatory trajectory under subsequent administrations remains uncertain.
China's New Energy Vehicle (NEV) mandate requires automakers to earn NEV credits equivalent to 18% of their sales in 2026, rising to 28% by 2030. This has made China the world's largest EV market and driven extraordinary cost reductions in battery technology — the average lithium-ion battery pack price fell from $1,200/kWh in 2010 to $97/kWh in 2025, a 92% reduction that has made EVs cost-competitive with ICE vehicles in most vehicle segments in China.
Fuel economy standards in developing nations are catching up but remain weaker. India's CAFE Phase 2 standards (effective 2022) require 113g CO₂/km for new cars — equivalent to approximately 55 MPG — but enforcement is inconsistent and the used vehicle market (which dominates sales in many developing countries) is entirely unregulated. The ICCT estimates that harmonising global fuel economy standards to best-practice levels would reduce global fuel consumption by 12.4 Mbbl/day by 2035 — equivalent to eliminating all road transport fuel demand in North America. For more on how these policies affect EV economics, see our Best EVs Under $40,000 guide.
| Region/Country | Standard | Target | ZEV Mandate |
|---|---|---|---|
| European Union | CO₂ Fleet Standard | 0g CO₂/km by 2035 | 100% by 2035 |
| United Kingdom | ZEV Mandate | 0g CO₂/km by 2035 | 100% by 2035 |
| USA (Federal) | CAFE Standards | 49 MPG (2026) | No federal mandate |
| California + 17 states | ACC II / ZEV | 0g CO₂/km by 2035 | 100% by 2035 |
| China | NEV Credit System | 28% NEV credits by 2030 | Credit-based |
| Japan | Top Runner | 42.6 MPG fleet avg | 100% electrified by 2035 |
| India | CAFE Phase 2 | 113g CO₂/km | No mandate |
Table 2: Global fuel economy and ZEV mandate comparison 2026. Source: ICCT, IEA, national regulatory agencies.
10. Outlook to 2030: Peak Oil Demand Scenarios
The IEA's 2026 World Energy Outlook presents three scenarios for global road fuel demand through 2030. In the Stated Policies Scenario (STEPS) — which assumes only currently enacted policies are implemented — road fuel demand peaks at 103.4 Mbbl/day in 2028 and declines to 99.1 Mbbl/day by 2030. In the Announced Pledges Scenario (APS) — which assumes all government net-zero pledges are met — demand peaks in 2026 and falls to 91.2 Mbbl/day by 2030. In the Net Zero Emissions (NZE) Scenario — consistent with limiting warming to 1.5°C — demand falls to 78.4 Mbbl/day by 2030, requiring an unprecedented acceleration of EV adoption and efficiency improvements.
The most likely outcome lies between STEPS and APS. Key variables include: the pace of battery cost reduction (currently tracking ahead of IEA projections), the speed of charging infrastructure deployment, the trajectory of EV adoption in India and Southeast Asia, and the durability of fuel economy standards in the face of political headwinds. The OPEC+ cartel, which controls 40% of global oil production, has consistently projected that peak oil demand will not occur before 2040 — a forecast that serves its members' interests but is increasingly at odds with market data.
For consumers and businesses, the practical implications are clear. Fuel costs will remain significant for at least the next decade, making vehicle fuel efficiency a critical factor in total cost of ownership calculations. The fuel cost differential between an efficient hybrid and an average SUV amounts to approximately $1,200–$1,800 per year at current prices — a figure that compounds significantly over a typical 7-year ownership period. As EV purchase prices continue to fall toward parity with ICE vehicles (projected for the mass market by 2027–2028 in most major markets), the economic case for electrification will become irresistible for most consumers. To model your own fuel costs, use our Car Cost Calculator.
Key Takeaways: Global Fuel Consumption 2026
- ✓Global road fuel consumption stands at 100.8 Mbbl/day — marginally below the 2024 peak of 102.1 Mbbl/day.
- ✓Asia-Pacific accounts for 38.3% of global consumption; North America for 28.2% — despite having far fewer people.
- ✓EVs now represent 18.2% of new vehicle sales globally but only 5.8% of the total fleet, limiting near-term fuel demand impact.
- ✓Japan leads on fleet efficiency (42.6 MPG); the USA lags at 26.4 MPG due to the dominance of SUVs and light trucks.
- ✓Road transport emits 6.0 Gt CO₂/year — 16.2% of global greenhouse gas emissions.
- ✓Peak road fuel demand is projected between 2026 and 2028 under most credible scenarios.
- ✓Fuel subsidies of $7 trillion/year remain the single largest barrier to demand reduction.
Citations & Data Sources
- International Energy Agency (IEA). World Energy Outlook 2026. Paris: IEA, 2026. iea.org
- International Council on Clean Transportation (ICCT). Global Fuel Economy Initiative 2026 Progress Report. Washington DC: ICCT, 2026. theicct.org
- OPEC. World Oil Outlook 2026. Vienna: OPEC Secretariat, 2026. opec.org
- International Monetary Fund (IMF). Fossil Fuel Subsidies: Implications for Public Finances and Climate Change. Washington DC: IMF, 2023. imf.org
- EV-Volumes. Global EV Sales Database 2026. EV-Volumes.com, 2026. ev-volumes.com
- US Energy Information Administration (EIA). International Energy Statistics: Motor Gasoline Prices. Washington DC: EIA, 2026. eia.gov
- BloombergNEF. Electric Vehicle Outlook 2026. New York: BloombergNEF, 2026. bnef.com
- World Bank. Sustainable Mobility for All: Global Mobility Report 2026. Washington DC: World Bank, 2026. worldbank.org
Related Articles & Tools
Advertisement
Advertisement