
With average car prices at $49,758, budgeting before you shop is more critical than ever. Photo: Unsplash
Advertisement
The 2026 Car Affordability Crisis: By the Numbers
Something broke in the American car market between 2020 and 2026. The average new car price jumped from $38,948 to $49,758 — a 27.7% increase in just six years. Meanwhile, median household income grew only 19.9% over the same period. The gap between what cars cost and what Americans earn has never been wider in the modern era.
According to Experian's Q2 2026 State of the Automotive Finance Market report, the average monthly new car payment reached $751 — up from $554 in 2019. That's an extra $197/month, or $2,364/year, that American households are now spending on car payments compared to seven years ago. For a family earning the median household income of $80,940, that payment represents 11.1% of gross monthly income — before insurance, fuel, or maintenance.
Add insurance ($168/month average per the Insurance Information Institute 2026), fuel ($200/month average), and maintenance ($100/month), and the total monthly car cost hits $1,219/month — consuming 18.1% of median gross income. Financial advisors recommend keeping total transportation costs under 15–20% of gross income. The average American car buyer in 2026 is already at the absolute ceiling.
Car Payment as % of Median Household Income (2015–2026)
Source: Experian Automotive Finance Market Reports, U.S. Census Bureau ACS
The red dashed line shows payment as % of income crossing the 10% guideline in 2022 and accelerating to 14.2% in 2026
⚠️ The Underwater Loan Problem
Cox Automotive reports that 38% of new car buyers in 2026 are rolling negative equity from a previous loan into their new purchase — averaging $6,458 in negative equity per transaction. This means nearly 4 in 10 buyers start their new loan already owing more than their car is worth.
The Affordability Rules: 10%, 15%, 20/4/10 Explained
Three main rules govern car affordability. Each has different risk tolerance and different implications for how much car you can buy in 2026's high-price, high-rate environment.
Keep your monthly car payment (loan only) under 10% of gross monthly income.
$75K salary → $625/mo max payment → ~$36,000 car
Best for: People with student loans, high rent, or building an emergency fund
Keep total car costs (payment + insurance) under 15% of gross monthly income.
$75K salary → $938/mo total → ~$45,000 car (after $168 insurance)
Best for: Most middle-income households with stable finances
20% down, 4-year loan max, payment under 10% of gross income.
$75K salary → $625/mo max → ~$26,500 car (4yr at 7.14%)
Best for: Disciplined savers who want to minimize total interest paid
Affordability Rule Comparison vs Average 2026 Buyer
Based on $80,940 median household income. Source: Experian, U.S. Census Bureau
The red dashed line shows the average 2026 car price. Only the 20% rule allows buying at this price level — and only barely.
The uncomfortable truth: at the median U.S. income of $80,940, following the conservative 10% rule means you can afford a car priced around $36,700. The average new car costs $49,758. That's a $13,058 gap between what financial wisdom recommends and what the market is selling.
This is why buying used has become the financially responsible choice for most Americans in 2026. A 3-year-old vehicle priced at $28,200 (the 2026 used car average) fits comfortably within the 10% rule for anyone earning $60,000+.
Interactive: How Much Car Can You Afford?
Enter your annual gross income to see your personalized car budget based on both the 10% and 15% rules, using current 2026 rates (7.14% APR, 60-month term).
🧮 Your Car Affordability Calculator
⚠️ These figures are estimates. Use our full TCO calculator for a complete cost breakdown including insurance, fuel, and maintenance.
Important note on the multiplier: The ~55x multiplier used above assumes a 60-month loan at 7.14% APR with 10% down. If you plan to put 20% down, multiply your max monthly payment by ~65 instead. If you're considering a 72-month loan (not recommended), the multiplier rises to ~70 — but you'll pay significantly more in total interest. See our complete car loan rates guide for a full breakdown of how loan terms affect total cost.
Car Budget by Income Level: 2026 Data
Here's what the numbers look like across different income levels, using the 15% rule (total car cost including insurance) and current 2026 rates. These figures assume 10% down, 60-month loan at 7.14% APR, and $168/month insurance.
Max Car Price by Income Level (15% Rule, 2026)
Source: Experian Q2 2026, Federal Reserve, CarCostBreakdown analysis
| Annual Income | Max Payment (15%) | Max Car Price | Recommended |
|---|---|---|---|
| $40K | $333/mo | $18,200 | Used compact |
| $50K | $417/mo | $22,800 | Used mid-size |
| $60K | $500/mo | $27,300 | New compact |
| $75K | $625/mo | $34,100 | New mid-size |
| $100K | $833/mo | $45,500 | New SUV/Luxury |
| $125K | $1,042/mo | $56,900 | Luxury/Performance |
| $150K | $1,250/mo | $68,200 | Luxury/Exotic |
💡 The $60K Income Reality Check
If you earn $60,000/year, the 15% rule gives you a max car price of approximately $27,300. The average new car costs $49,758. That's a $22,458 gap. At $60K income, buying new is financially irresponsible by most standards — unless you have a substantial down payment (30%+) or are buying a significantly below-average-priced new vehicle. The math simply doesn't work. A 3-year-old used car in the $22,000–$28,000 range is the financially sound choice.
The data reveals a stark reality: to comfortably afford the average new car at $49,758 under the 15% rule, you need an annual income of at least $87,000. Only about 35% of American households earn that much. Yet new car sales continue — largely because buyers are stretching loan terms to 72 or 84 months to make payments appear manageable, while ignoring the total cost of ownership.
For a deeper dive into how salary translates to car budget, see our dedicated guide: Car Budget by Salary: What You Can Afford at Every Income Level.
Down Payment Strategy: Why 20% Matters More Than Ever in 2026
Advertisement

A 20% down payment on a $49,758 car saves $3,684 in interest and prevents being underwater on your loan. Photo: Unsplash
The down payment is the most powerful lever in car affordability — yet it's the one most buyers minimize. In Q2 2026, the average down payment on a new car was just 11.4% ($5,672), according to Edmunds. That's dangerously low given that new cars depreciate 15–20% in their first year.
When you put less than 20% down on a new car, you're almost guaranteed to be underwater on your loan (owing more than the car is worth) within the first 12–18 months. This creates a debt trap: if you need to sell or trade in, you'll owe more than you receive, forcing you to roll negative equity into your next loan.
Down Payment Impact on Monthly Payment & Total Cost ($49,758 car, 7.14% APR, 60 months)
Source: CarCostBreakdown analysis using Experian 2026 average rate data
Going from 0% to 20% down saves $205/month and $6,684 in total cost over the loan term
❌ 0% Down (Common Mistake)
- • Monthly payment: $1,023
- • Total interest: $12,276
- • Underwater for 18–24 months
- • Negative equity risk: HIGH
✅ 20% Down (Recommended)
- • Monthly payment: $818
- • Total interest: $9,816
- • Equity from day one
- • Negative equity risk: LOW
If you don't have 20% saved, consider delaying your purchase. Saving an additional $5,000–$10,000 before buying can save you thousands in interest and protect you from the negative equity trap. Our guide to saving for a car outlines a 6–18 month savings plan for different income levels.
The True Cost of Car Ownership Beyond the Payment
The monthly payment is just one piece of the car ownership puzzle — and often the smallest piece when you account for depreciation. AAA's 2026 Your Driving Costs study found that the average annual cost of owning and operating a new vehicle is $12,182 — or $1,015/month. Here's how that breaks down:
Annual Car Ownership Cost Breakdown (Average New Car, 2026)
Source: AAA Your Driving Costs 2026, Insurance Information Institute, EIA
The most overlooked cost is depreciation — at $4,800/year on average, it's the single largest cost of car ownership, yet it never shows up on a monthly statement. A new car loses approximately 15–20% of its value in year one, and 10–15% per year thereafter. On a $49,758 car, that's $7,464–$9,952 in value lost in the first 12 months alone.
This is why our Total Cost of Ownership calculator factors in depreciation, insurance, fuel, and maintenance — not just the loan payment. The true monthly cost of owning the average new car in 2026 is $1,015/month, not $751.
📊 True Monthly Cost vs Payment-Only View
The $264/month gap represents insurance, fuel, maintenance, and depreciation — costs that don't disappear just because you don't see them on a bill.
New vs Used: Which Fits Your Budget in 2026?
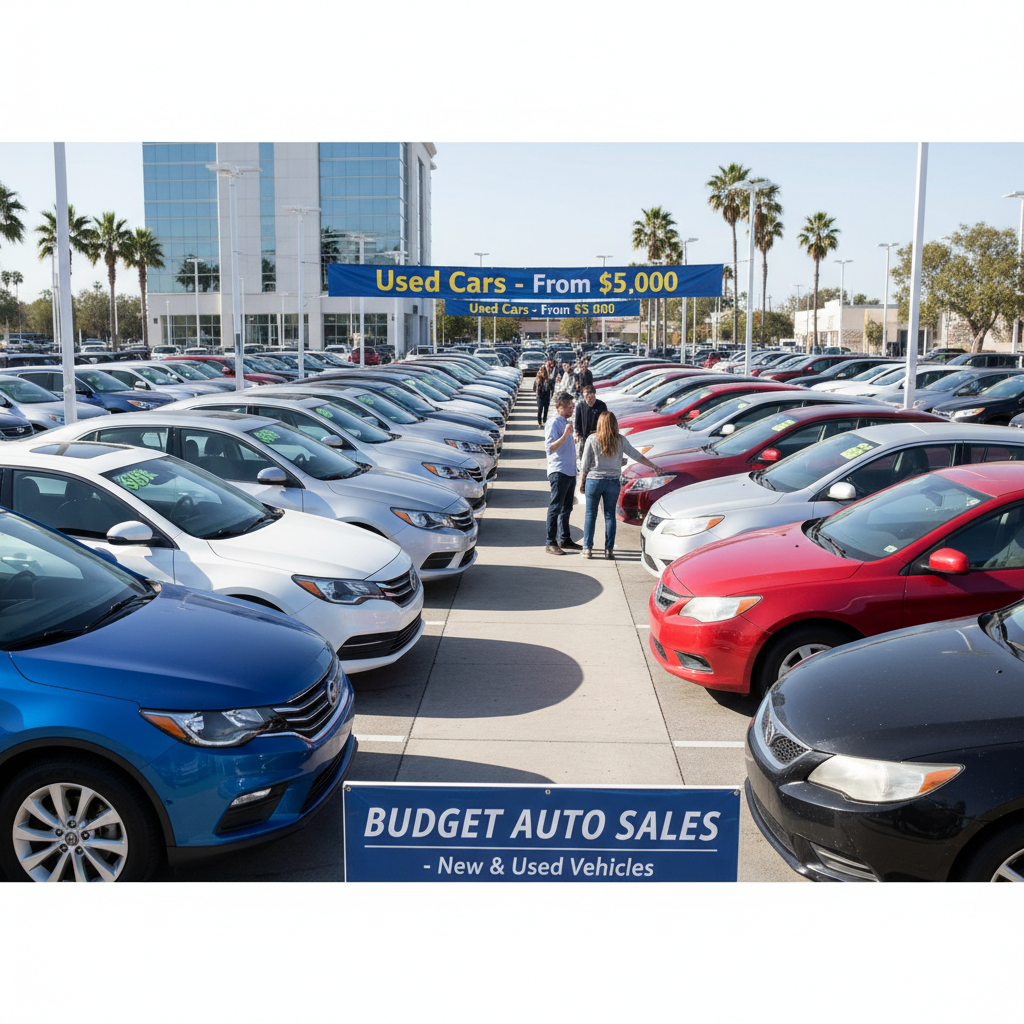
Used car prices have dropped 18% from their 2022 peak, creating real value opportunities for budget-conscious buyers. Photo: Unsplash
Used car prices peaked in January 2022 at an average of $31,109 (Manheim Used Vehicle Value Index) and have since declined to $28,200 in Q2 2026 — a 9.3% drop from peak. Meanwhile, new car prices have continued rising. This creates a meaningful value gap that budget-conscious buyers should exploit.
| Factor | New Car | 3-Year-Old Used |
|---|---|---|
| Average Price (2026) | $49,758 | $28,200 |
| Avg Loan Rate | 7.14% APR | 11.38% APR |
| Monthly Payment (60mo) | $985 | $616 |
| Year 1 Depreciation | $7,464–$9,952 | $2,820–$4,230 |
| Avg Annual Maintenance | $1,200 | $1,800 |
| Warranty Coverage | Full factory | Limited/none |
| 5-Year Total Cost | ~$58,200 | ~$42,800 |
| Income Needed (15% rule) | $87,000+ | $49,000+ |
The used car advantage is clear for most income levels. Despite higher interest rates (11.38% vs 7.14% for new), the lower purchase price more than compensates. A 3-year-old used car at $28,200 with a 60-month loan at 11.38% APR produces a $616/month payment — $369 less than the average new car payment. Over 5 years, that's $22,140 in savings.
The sweet spot for used car value in 2026 is vehicles that are 2–4 years old. They've absorbed the steepest depreciation (40–50% of total lifetime depreciation), often still have some manufacturer warranty remaining, and benefit from modern safety and technology features. See our complete new vs used cost comparison for model-specific breakdowns.
7 Biggest Car Budgeting Mistakes in 2026
These are the mistakes that turn a manageable car purchase into a financial burden. Each one is extremely common — and entirely avoidable.
Focusing Only on Monthly Payment
Dealers love to negotiate on monthly payment because it obscures the total cost. A $50 reduction in monthly payment on a 72-month loan can hide $3,600 in additional total cost. Always negotiate on total price, not monthly payment.
⚠️ Can cost $3,000–$8,000 extraStretching to 72 or 84-Month Loans
The average loan term hit 68.5 months in 2026. Extending to 84 months to lower payments means you'll be paying for a car that's 7 years old — likely with significant repair costs — while still making loan payments. You'll also pay $4,000–$6,000 more in total interest.
⚠️ Costs $4,000–$6,000 in extra interestIgnoring Total Cost of Ownership
A $35,000 luxury car can cost $18,000/year to own when you factor in insurance ($3,200+), premium fuel, higher maintenance, and faster depreciation. A $28,000 reliable sedan might cost $10,500/year total. The $7,000 sticker difference becomes a $7,500/year ownership cost difference.
⚠️ Can double your real annual costRolling Negative Equity Forward
38% of buyers in 2026 roll an average of $6,458 in negative equity into their new loan. This means starting $6,458 underwater on a depreciating asset. It's a debt spiral that compounds with each trade-in.
⚠️ Average $6,458 in hidden debtNot Shopping Insurance Before Buying
Insurance costs vary by 200–400% for the same driver depending on the vehicle. A sports car or luxury SUV can cost $3,000–$5,000/year to insure vs $1,200–$1,800 for a sedan. Get insurance quotes before you commit to a vehicle.
⚠️ Can add $1,500–$3,000/yearBuying New When Used Fits Your Budget
For anyone earning under $75,000/year, buying new at current prices means violating every affordability guideline. A 2–4 year old certified pre-owned vehicle provides 90% of the new car experience at 55–65% of the price.
⚠️ Overspending by $15,000–$25,000Skipping Pre-Purchase Inspection on Used Cars
A $150 pre-purchase inspection by an independent mechanic can reveal $2,000–$10,000 in needed repairs. Skipping it to save $150 is one of the worst financial decisions in car buying. Always inspect before you buy.
⚠️ Can reveal $2,000–$10,000 in issuesReady to Calculate Your True Car Budget?
Use our free tools to get a complete picture of what a car will actually cost you — including depreciation, insurance, fuel, and maintenance.
Frequently Asked Questions
Sources & Citations
- [1]Experian. (2026, Q2). State of the Automotive Finance Market. Experian Automotive.
- [2]Cox Automotive. (2026, August). Negative Equity in Auto Loans Report. Cox Automotive Insights.
- [3]AAA. (2026). Your Driving Costs: How Much Are You Really Paying to Drive? AAA Newsroom.
- [4]Edmunds. (2026, Q2). Used Vehicle Market Report. Edmunds Industry Center.
- [5]U.S. Census Bureau. (2026). American Community Survey: Median Household Income. census.gov.
- [6]Insurance Information Institute. (2026). Auto Insurance Average Expenditures. iii.org.
- [7]Manheim. (2026, Q2). Used Vehicle Value Index. Manheim Consulting.
- [8]Federal Reserve Bank of New York. (2026). Center for Microeconomic Data: Auto Loan Originations. newyorkfed.org.
- [9]Kelley Blue Book. (2026, August). New-Car Transaction Prices. kbb.com.
- [10]J.D. Power. (2026). U.S. Auto Loan Origination Satisfaction Study. jdpower.com.
Related Guides
Car Loan Rates 2026: Complete Guide
How to get the best rate and save $3,000+
The 20/4/10 Rule: Does It Still Work?
Updated analysis for 2026 car prices
New vs Used: Total Cost Comparison
5-year breakeven analysis for 10 models
Hidden Car Costs Nobody Tells You About
The costs that blow most car budgets
How to Save for a Car: 6–18 Month Plan
Build your down payment faster
Car Budget by Salary Guide
What you can afford at every income level
Advertisement